 New
New
 Free
Free
 Home
Home

In today's data-driven world, the need to analyze and interpret vast amounts of information has become more important than ever. This is where ChartGPT Cadlabs comes in. As an AI tool specifically designed to generate charts and provide answers to data-centric questions, ChartGPT serves as a personal data assistant, helping users navigate through the complexities of data exploration. With its intuitive and user-friendly interface, ChartGPT has quickly become a go-to tool for professionals across a wide range of industries.
Usage: Productivity
Pricing: Contact for Rates
For more information, jump to:
Screenshots | Videos | Similar Tools | FAQs | Pros and Cons | Facts


Product Screenshots

Video Reviews
-
These 10 Ai Tools Will Make You RICH (Must See)
YouTube
Similar Tools to ChartGPT Cadlabs
-
We introduce solutions that help you create presentation designs professionally yet easily. Our mission is shaping the future of how everyone presents his idea by building the all-in-one presentation design solution and empowering everyone to design outstanding presentations.
 Free
#Presentation
Free
#Presentation
-
In today's data-driven world, the need to analyze and interpret vast amounts of information has become more important than ever. This is where ChartGPT Cadlabs comes in. As an AI tool specifically designed to generate charts and provide answers to data-centric questions, ChartGPT serves as a personal data assistant, helping users navigate through the complexities of data exploration. With its intuitive and user-friendly interface, ChartGPT has quickly become a go-to tool for professionals across a wide range of industries.
Contact for Rates
#Presentation
-
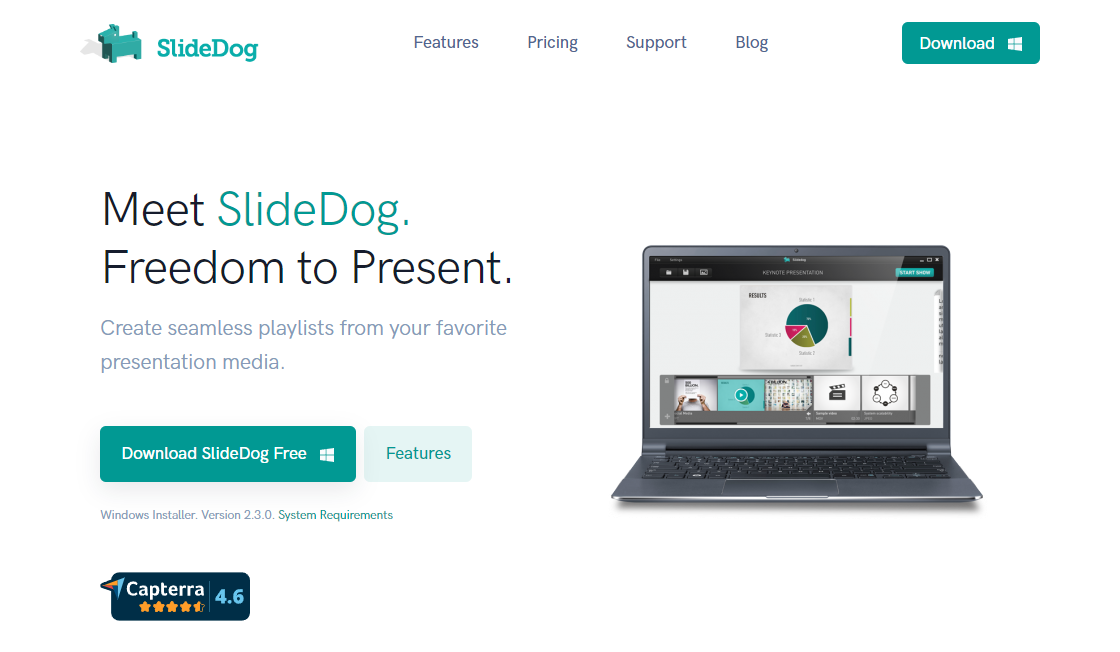
SlideDog is a powerful presentation software that enables users to create and present interactive multimedia presentations effortlessly. This software offers a range of features, including the ability to seamlessly integrate various media types such as videos, images, and slides into a single presentation. It also allows for real-time audience engagement through live polls, feedback, and interactive Q&A sessions. With SlideDog, users can create visually appealing and engaging presentations that captivate their audience and leave a lasting impression. Whether it's for work, education or personal use, SlideDog is an excellent choice for anyone seeking to enhance their presentation skills.
Contact for Rates
#Presentation
-
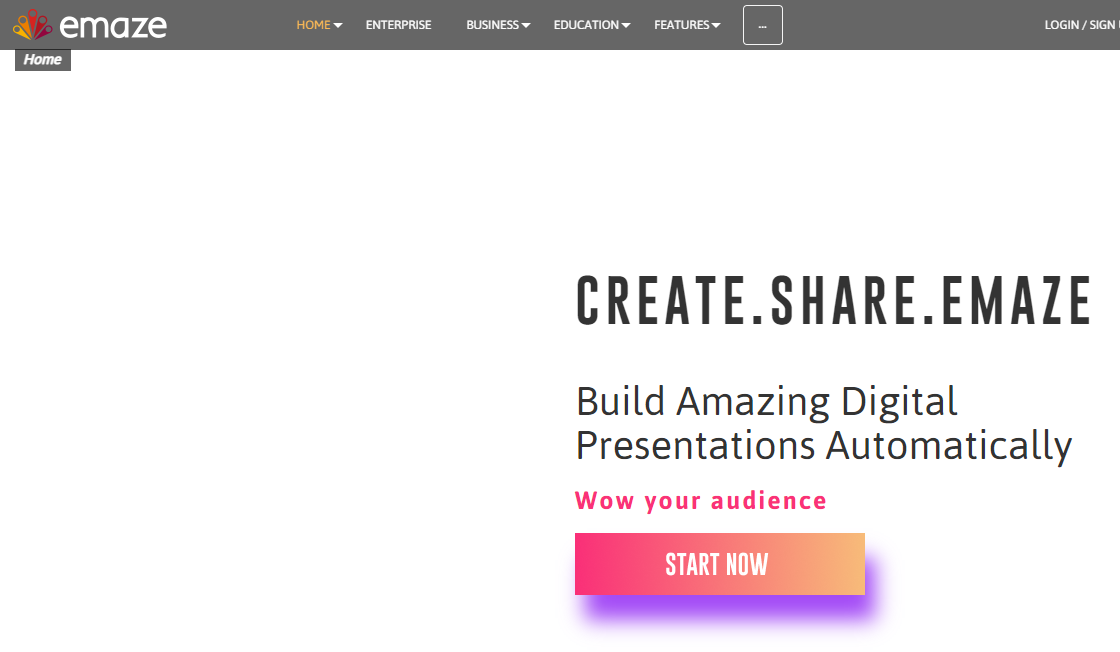
Emaze is a cloud-based presentation software that has revolutionized the way people create and deliver presentations. With its user-friendly interface, Emaze allows users to create beautiful and engaging presentations that capture the attention of their audience. This innovative software provides a range of customizable templates and design tools that enable users to create stunning visuals and animations. Whether you're a student, educator, or business professional, Emaze is the perfect tool for creating dynamic and captivating presentations that leave a lasting impression on your audience.
Contact for Rates
#Presentation
-
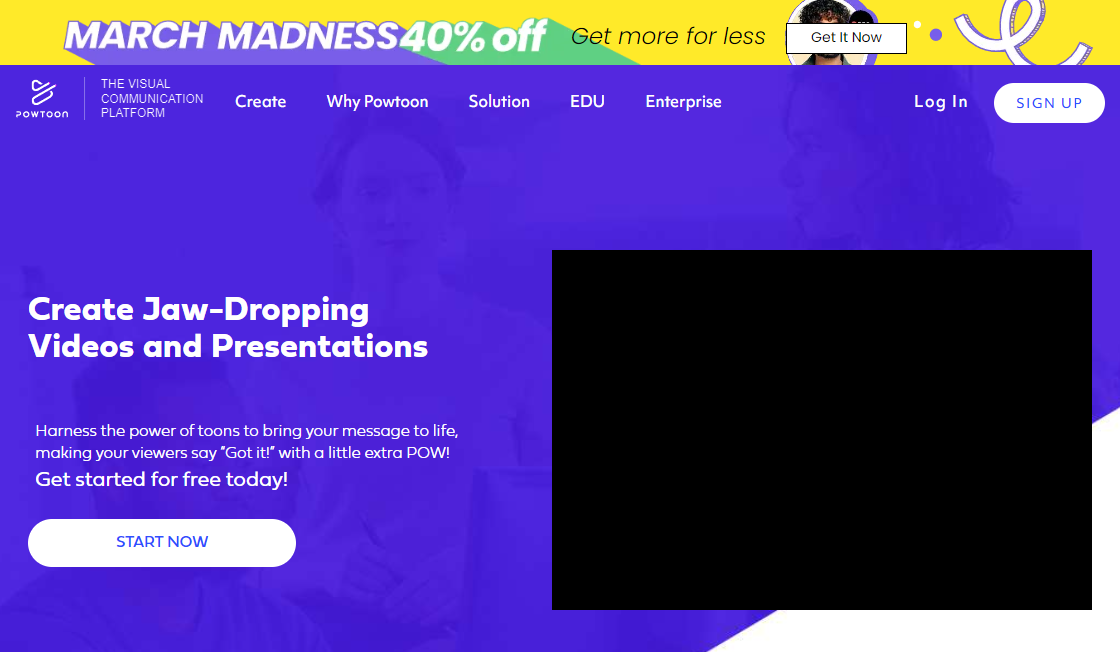
Powtoon is a cloud-based software that allows users to easily create animated presentations, explainer videos, and other types of engaging visual content. With its user-friendly interface and wide range of customizable templates, Powtoon has become a popular choice for businesses, educators, and individuals looking to spice up their presentations or marketing campaigns. From explainer videos to product demos, Powtoon offers a variety of tools to help users create high-quality and engaging content without the need for advanced design skills. In this article, we will explore the features and benefits of Powtoon and how it can help you bring your ideas to life.
Paid
#Presentation
-
Graphy app is an innovative solution designed to empower businesses in effortlessly producing captivating and dynamic data visualizations. By harnessing the capabilities of artificial intelligence, this tool delivers a seamless chart-making experience, eliminating the necessity for complex technical expertise. With Graphy, users can create visually stunning charts and graphs that not only captivate their audience but also provide valuable insights. This free app serves as a valuable asset for businesses seeking to efficiently communicate complex data in an engaging manner.
Contact for Rates
#Presentation


Top Rated Tools
-
Opera
Browser with Built-in VPN
Contact for Rates #Browser -
MarioGPT
AI-generated Super Mario Levels
Contact for Rates #Game Development -
Chatsonic
ChatSonic - A ChatGPT alternative with superpowers
Paid #Chatgpt Alternative -
TinyWow
Free AI Writing, PDF, Image, and other Online Tools - TinyWow
Free #Life Assistant -
Speechify
Best Free Text To Speech Voice Reader | Speechify
Paid #Productivity -
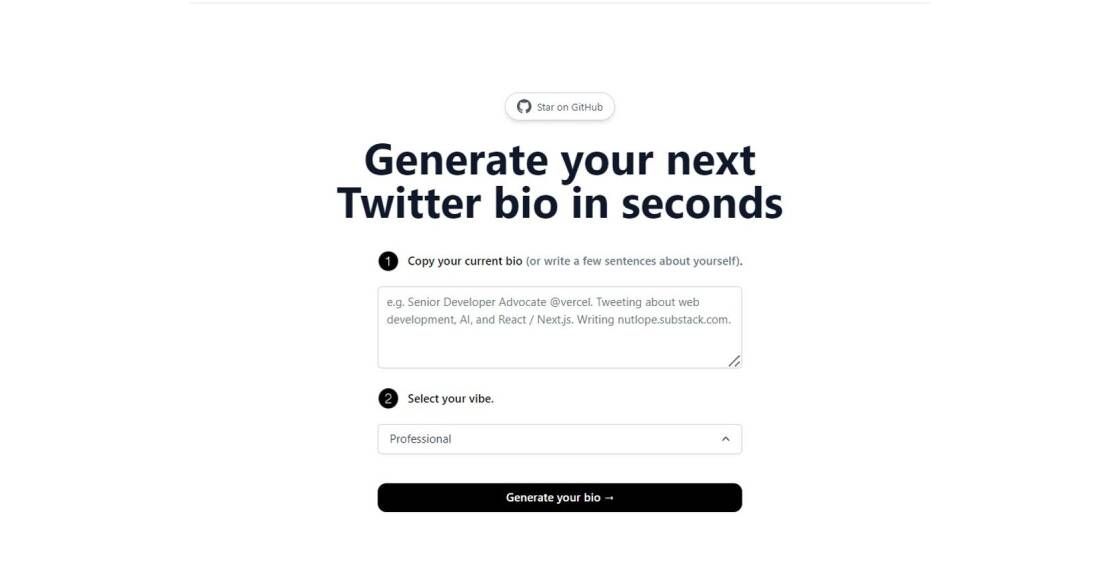
TwitterBio
AI Twitter Bio Generator – Vercel
-
Voice-AI
Voice Analysis and Optimization
Freemium #Audio Editing -
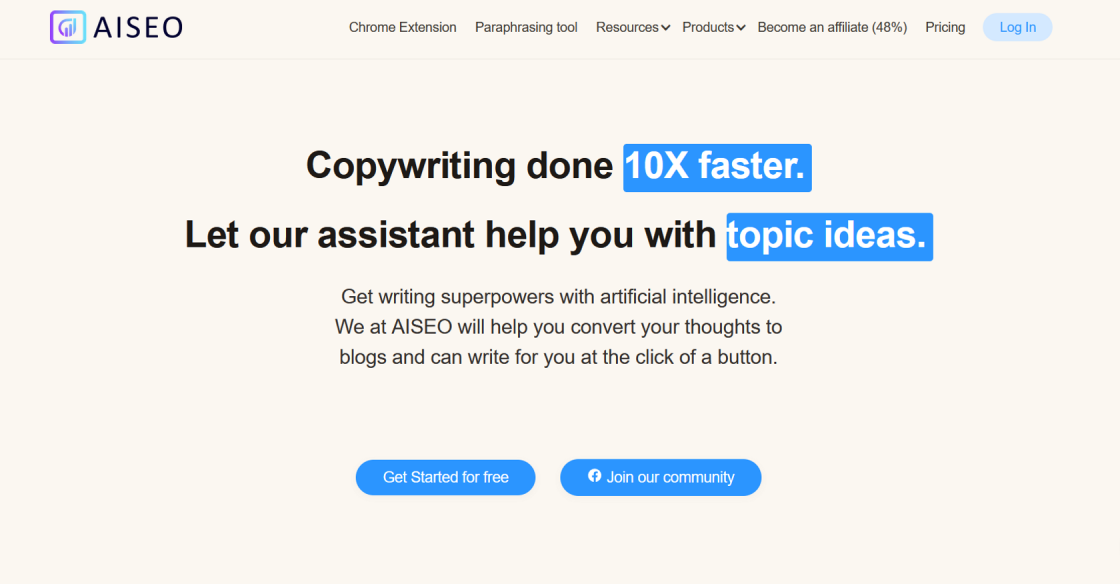
AISEO
AISEO - AI writing assistant, Copywriting & Paraphrasing Tool
Free Trial #Writing Assistant


ChartGPT Cadlabs is an innovative AI-powered tool that has revolutionized the way we navigate through data. As data is becoming the most valuable asset in today's world, businesses and individuals need to make sense of it to gain insights and make informed decisions. The solution is ChartGPT - a personal data assistant that guides users through data exploration by generating insightful charts and answering data-centric questions.
The AI tool employs advanced algorithms to scour through vast amounts of data, analyze trends, and present results in a visually appealing format. This makes data analysis accessible to everyone, irrespective of their technical expertise, enabling quick decision-making and informed actions. With its intuitive interface and user-friendly features, ChartGPT is a valuable asset for data analysts, researchers, journalists, and anyone who needs to make sense of data quickly and efficiently.
In essence, ChartGPT is a game-changer in the world of data analysis, making complex data sets more accessible and understandable. Whether you're working on a research project or seeking to extract insights from your business data, ChartGPT is a must-have tool that will transform your data analysis and save you time and effort.

Top FAQ on ChartGPT Cadlabs
1. What is ChartGPT?
ChartGPT is an AI tool designed to generate charts and answer data-centric questions.
2. What does ChartGPT do?
ChartGPT serves as a personal data assistant, guiding users through data exploration.
3. How does ChartGPT guide users through data exploration?
ChartGPT generates charts and answers data-centric questions, helping users to better understand their data.
4. Can ChartGPT be used to generate any type of chart?
Yes, ChartGPT can generate a wide variety of charts based on the input data.
5. Is ChartGPT easy to use?
Yes, ChartGPT is designed to be user-friendly and intuitive for users of all skill levels.
6. Can ChartGPT be integrated with other data analysis tools?
Yes, ChartGPT can be integrated with other data analysis tools to provide a more comprehensive analysis of the data.
7. Is ChartGPT suitable for both small and large datasets?
Yes, ChartGPT can handle datasets of various sizes, from small to very large.
8. Is ChartGPT available for both desktop and mobile devices?
Yes, ChartGPT is available for both desktop and mobile devices, making it convenient for users to access and analyze data on-the-go.
9. Does ChartGPT offer any customization options?
Yes, ChartGPT offers customization options such as changing chart types and adjusting chart parameters to further refine data analysis.
10. How can users get started with ChartGPT?
Users can get started with ChartGPT by signing up for a free trial or purchasing a subscription plan on the Cadlabs website.
11. Are there any alternatives to ChartGPT Cadlabs?
| Competitor | Features | Differences |
|---|---|---|
| Tableau | - Data visualization - Business intelligence - Data discovery and exploration - Dashboard creation |
Tableau offers a wider range of features than ChartGPT, including advanced business intelligence capabilities. It is more suitable for organizations with complex data analysis requirements. |
| Microsoft Power BI | - Data visualization - Business intelligence - Interactive reporting - AI-powered insights - Cloud-based collaboration |
Power BI offers advanced AI-powered insights and cloud-based collaboration, making it more suitable for larger teams and organizations. |
| QlikView | - Data visualization and exploration - Business intelligence - Real-time data analytics - Dashboard creation - Mobile access |
QlikView is more focused on real-time data analytics and mobile access, making it a great tool for industries that require instant decision-making based on their data. |
| Domo | - Business intelligence and data visualization - Dashboard creation - Predictive analytics - Data integration and management - Mobile access |
Domo focuses more on predictive analytics and data integration and management, making it a suitable tool for organizations that deal with large amounts of data from various sources. |
| Looker | - Business intelligence and data visualization - Data exploration and discovery - Customizable dashboards - Collaborative analytics - Cloud-based platform |
Looker is more focused on collaborative analytics and cloud-based platform, making it a suitable tool for teams that need to work together on data analysis projects. |

Pros and Cons of ChartGPT Cadlabs
Pros
- Efficient and accurate chart generation
- Saves time by automating data exploration
- Provides insights and answers to data-centric questions
- Reduces user error and human bias in data analysis
- User-friendly interface for easy navigation and understanding
- Customizable charts and data visualizations
- Increases productivity and efficiency for businesses and individuals alike
Cons
- May not be user-friendly for individuals without a strong understanding of data analysis and chart creation
- Requires adequate input of high-quality data for accurate results
- May not be suitable for complex data sets or advanced data modeling
- Potential for errors or inaccuracies in generated charts and answers
- Limited customization options for charts and visualizations
- May be costly or require a subscription for full access to tool features.

Things You Didn't Know About ChartGPT Cadlabs
ChartGPT Cadlabs is an innovative AI tool that has been designed to make data exploration and analysis easier and more efficient. With ChartGPT, users can generate charts and graphs, and get answers to data-centric questions with ease. This AI tool operates as a personal data assistant, guiding users through the entire process of data exploration.
When using ChartGPT, users do not need to have any prior knowledge or experience in data analysis. The tool is easy to use, and it is designed to provide detailed guidance on each step of the data exploration process. Users can generate charts and graphs that are easy to read and interpret, making it possible to quickly make sense of complex data sets.
One of the most remarkable features of ChartGPT is its ability to answer data-centric questions. This AI tool can analyze data sets and provide users with accurate answers to their questions. This makes it possible for users to quickly extract useful insights from large volumes of data, which can be used to inform decision-making.
Another advantage of using ChartGPT is that it is flexible and customizable. Users can adjust the settings of the tool to suit their specific needs, enabling them to generate charts and graphs that are tailored to their requirements. Additionally, the tool can be integrated with a wide range of data sources, providing users with access to a wealth of data that they can explore and analyze.
In summary, ChartGPT Cadlabs is an essential tool for anyone involved in data exploration and analysis. Its ability to generate charts and graphs, answer data-centric questions, and guide users through the data exploration process makes it a valuable asset for businesses and organizations looking to improve their decision-making processes. Whether you are an analyst, a researcher, or a business owner, ChartGPT can help you make sense of complex data sets, and provide you with the insights you need to succeed.

edited by
Emily Collins is a freelance writer with over a decade of experience in the field. Emily has a passion for all things tech, especially AI-powered tools and GPT-3 & GPT-4 apps. She is a self-proclaimed geek and developer, always looking for the latest and greatest in software and coding. When she's not writing, Emily can usually be found tinkering with her computer, playing video games, or reading science fiction novels. With her unique combination of writing skills and tech expertise, Emily is a valuable asset to any project she takes on.


