 New
New
 Free
Free
 Home
Home


Chartio is a powerful data analytics tool that enables teams to explore, analyze, and visualize their data with ease. With its advanced query editing capabilities, exploration dashboards, and built-in alerts, Chartio provides valuable insights to help businesses make data-driven decisions. Additionally, the platform promotes instant collaboration among team members, making it an essential tool for companies of all sizes. By utilizing Chartio, teams can better understand their data and gain a competitive edge in their respective industries.
Usage: Data
Pricing: Free Trial - Subscription, free trial available
Tags: collaboration competitive edge analyze Data analytics explore
For more information, jump to:
Screenshots | Videos | Similar Tools | FAQs | Pros and Cons | Facts | Contact Info


Product Screenshots
Video Reviews
Similar Tools to Chartio
-
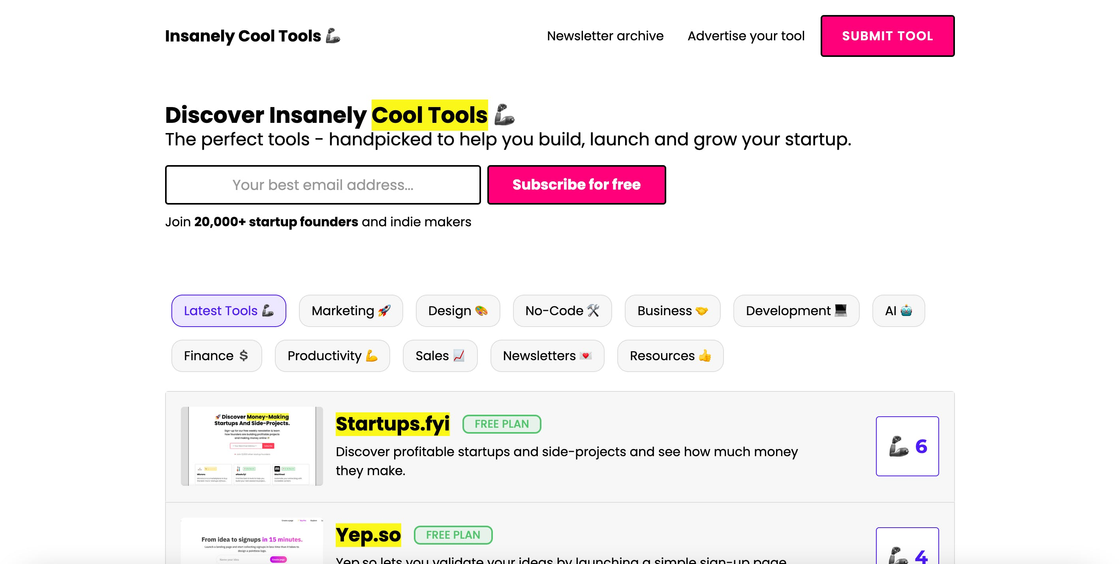
Insanely Cool Tools is a curated database of the best free tools and resources for startup founders. These are the perfect tools - handpicked to help you build, launch and grow your startup.
 Free
#Database
Free
#Database
-
Gnosis AI is an advanced AI-driven insights and analytics platform designed specifically for enterprises. With its cutting-edge technology, Gnosis AI aims to provide organizations with the ability to quickly and easily uncover valuable insights and make data-driven decisions. By leveraging machine learning algorithms and predictive analytics, Gnosis AI enables companies to gain a deeper understanding of their customers, products, and operations, ultimately driving growth and profitability. This platform is poised to revolutionize the way businesses approach data analysis and decision-making, offering a powerful toolset that is unmatched in the industry.
Contact for Rates
#Database
-
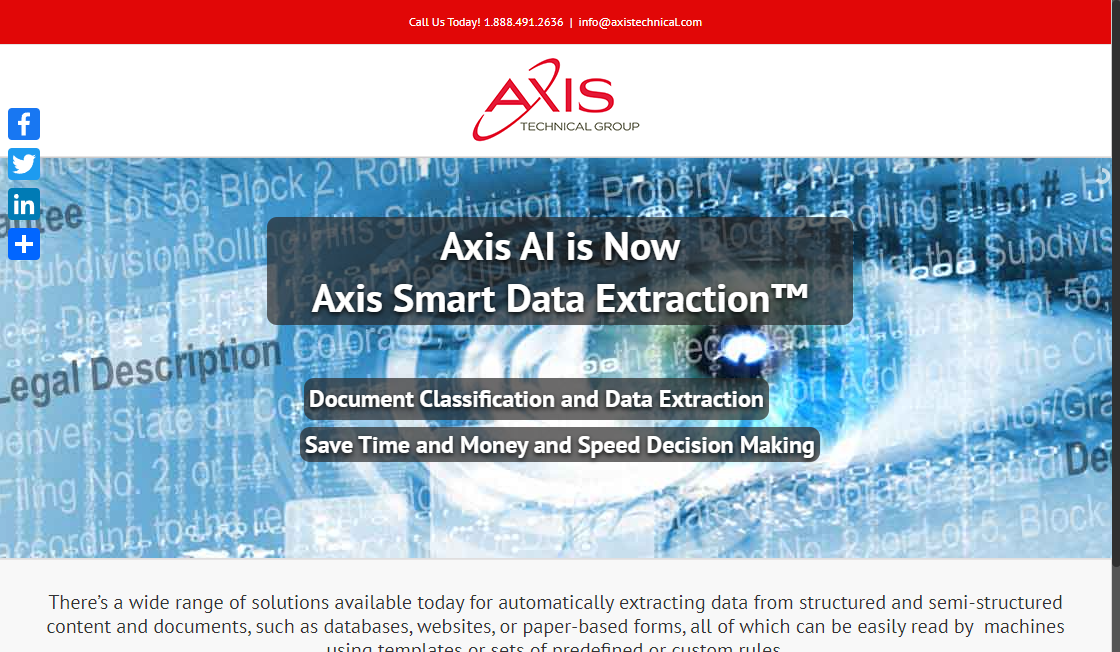
Axis AI is a cutting-edge platform that uses artificial intelligence (AI) to analyze data in real-time. This innovative technology has revolutionized the way businesses and organizations process large amounts of data, allowing them to make informed decisions quickly and efficiently. With its advanced computer vision capabilities, Axis AI can identify patterns, detect anomalies, and provide valuable insights that can help organizations improve their operations and increase their bottom line. Whether you're a small business owner or a large corporation, Axis AI is the perfect solution for anyone looking to stay ahead of the curve in today's fast-paced business landscape.
Contact for Rates
#Database
-
Ayasdi is a cutting-edge platform that harnesses the power of artificial intelligence (AI) to uncover hidden patterns and correlations in data. This technology enables businesses and organizations to sift through vast amounts of information and extract actionable insights, leading to improved decision-making and better outcomes. With Ayasdi, users can gain a deeper understanding of complex problems and identify solutions that would otherwise go unnoticed. By leveraging AI to reveal the connections and relationships within data, Ayasdi is transforming the way we approach analysis and problem-solving.
Contact for Rates
#Database
-
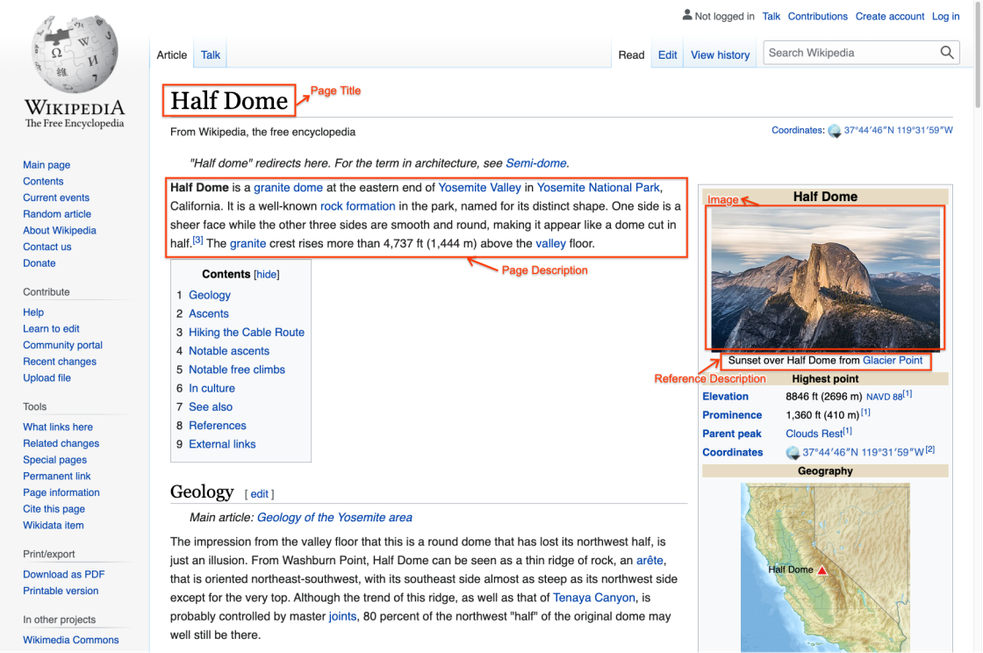
Google AI's WIT is a powerful dataset designed to facilitate multimodal and multilingual machine learning. It is based on Wikipedia, the world's largest online encyclopedia. This dataset is composed of images and text from multiple languages in order to provide a comprehensive resource for researchers and developers. Through this dataset, Google AI is able to promote research and development in the fields of machine learning and computer vision.
Contact for Rates
#Database
-
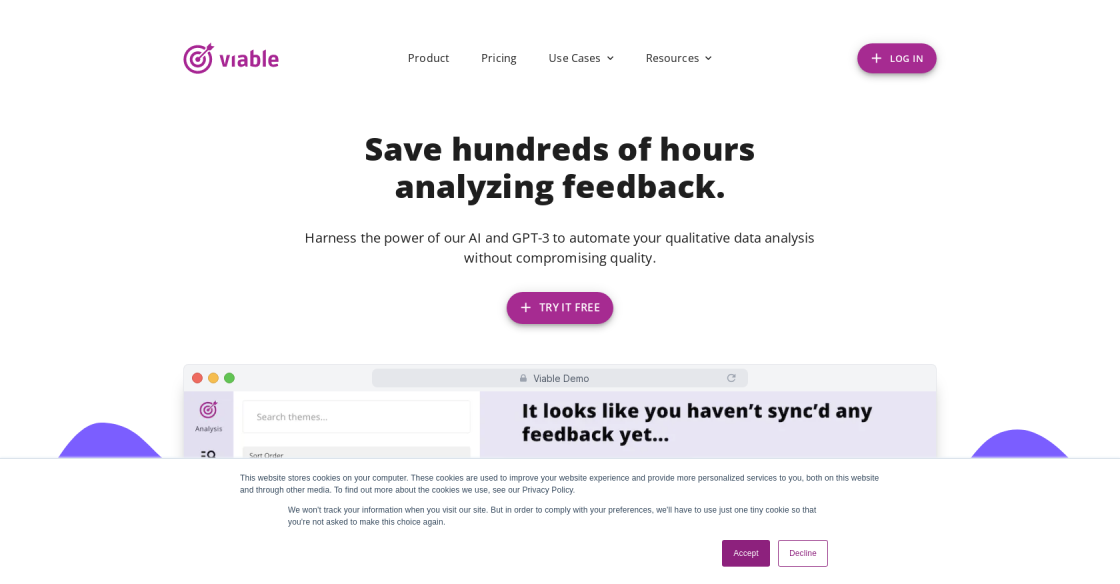
The ability to accurately analyze customer feedback is essential for any business that wants to succeed. With the introduction of Viable, a GPT-3 powered customer feedback analysis system, businesses now have access to a powerful tool to help them make informed decisions. Viable provides an easy and effective way to identify customer sentiment and preferences, allowing businesses to make smarter decisions and better serve their customers. With the help of advanced machine learning algorithms, Viable can quickly and accurately analyze customer feedback and present actionable insights.
Paid
#Customer Service
Top Rated Tools
-
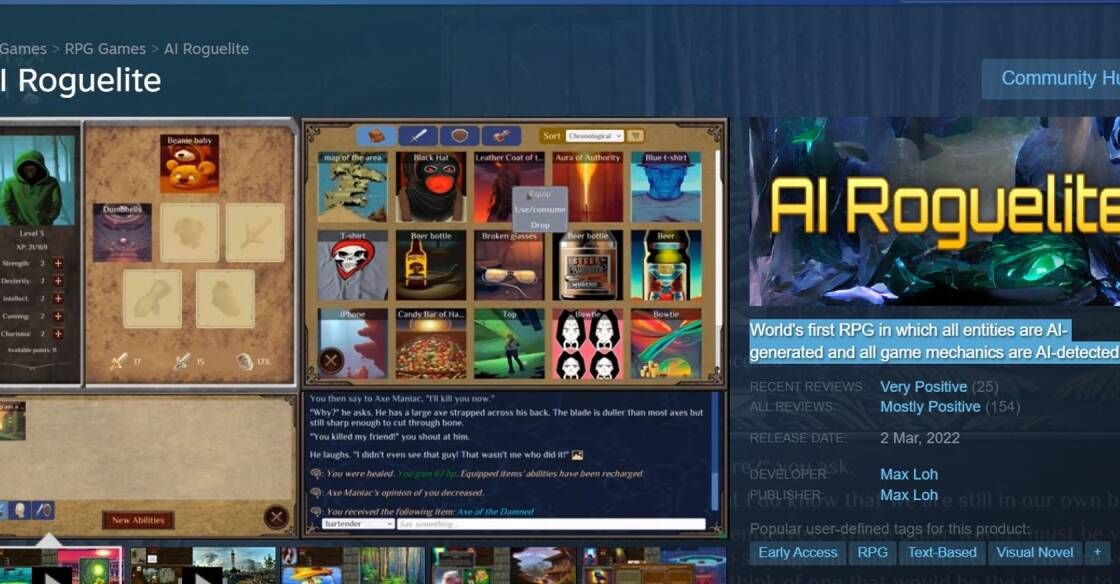
AI Roguelite
AI Roguelite on Steam
Paid #Game Development -
Writesonic
Writesonic - Best AI Writer, Copywriting & Paraphrasing Tool
Paid #Others -
RestorePhotos
Face Photo Restorer
Free #Image Editing -
Media.io
Media.io - Online Free Video Editor, Converter, Compressor
Contact for Rates #Image Editing -
Chai
AI Writing Assistant
Free #Conversation -
AI Content Detector
AI Content Detector | GPT-3 | ChatGPT - Writer
Contact for Rates #Plagiarism Checker -
Picsart
AI Writer - Create premium copy for free | Quicktools by Picsart
Paid #Design Assistant -
Tome AI
Tome - The AI-powered storytelling format
Contact for Rates #Presentation

In today's data-driven world, businesses and organizations rely heavily on data analysis to make informed decisions. However, interpreting and making sense of large volumes of data can be a daunting task. Chartio is a powerful tool that helps teams explore and analyze their data by providing intuitive data visualizations and insights. With its user-friendly interface, Chartio allows users to access and manipulate data with ease, even without technical expertise. The platform features robust query editing capabilities, exploration dashboards, built-in alerts, and instant collaboration to streamline data analysis and decision-making processes. With Chartio, teams can quickly identify trends, patterns, and anomalies in their data, enabling them to make data-driven decisions that drive growth and success. In this article, we will delve deeper into the features and benefits of Chartio and explore how it can help organizations transform their data into actionable insights.

Top FAQ on Chartio
1. What is Chartio?
Chartio is a platform that provides data visualizations and insights to help teams explore and analyze their data.
2. What are the features of Chartio?
Chartio includes powerful query editing capabilities, exploration dashboards, built-in alerts, and instant collaboration.
3. How can Chartio help businesses?
Chartio can help businesses by providing them with a better understanding of their data and enabling them to make informed decisions based on that data.
4. How does Chartio work?
Chartio works by connecting to various data sources and transforming the data into interactive visualizations that can be explored and analyzed by teams.
5. What type of data sources does Chartio support?
Chartio supports a wide range of data sources, including SQL databases, spreadsheets, and cloud applications such as Google Analytics and Salesforce.
6. Can Chartio be used for real-time data analysis?
Yes, Chartio can be used for real-time data analysis, allowing teams to monitor and respond to changes in their data as they happen.
7. What types of insights can be gained from using Chartio?
Insights that can be gained from using Chartio include identifying trends, detecting anomalies, and understanding the performance of specific areas of a business.
8. Is Chartio easy to use?
Yes, Chartio is designed to be user-friendly and intuitive, with drag-and-drop functionality and no coding required.
9. What type of support is available for Chartio users?
Chartio provides a range of support options, including email support, live chat, and an extensive knowledge base.
10. How much does Chartio cost?
Chartio offers a range of pricing plans to suit different business needs, starting at $149 per month for the Essentials plan.
11. Are there any alternatives to Chartio?
| Competitors | Description | Key Features | Pricing |
|---|---|---|---|
| Tableau | Data visualization and business intelligence software | Drag-and-drop interface, wide range of data connectors, real-time analytics, mobility | Starts at $70/user/month |
| Power BI | Business analytics service by Microsoft | Interactive visualizations, AI capabilities, integration with Microsoft products, cross-platform accessibility | Starts at $9.99/user/month |
| Looker | Business intelligence and data analytics platform | Customizable dashboards, data exploration, machine learning, big data processing | Custom pricing based on usage |
| QlikView | Business intelligence and data visualization platform | In-memory analytics, flexible data model, collaboration tools, mobile access | Custom pricing based on usage |
| Domo | Cloud-based business intelligence and data visualization platform | Real-time data, predictive analytics, data governance, mobile app | Custom pricing based on usage |

Pros and Cons of Chartio
Pros
- Provides data visualizations and insights to help teams explore and analyze their data.
- Includes powerful query editing capabilities.
- Offers exploration dashboards for easy data analysis.
- Comes with built-in alerts to keep users informed of changes in data.
- Enables instant collaboration for team members.
Cons
- Limited data sources supported
- Steep learning curve for beginners
- Expensive pricing plans
- Customization options are limited
- No built-in machine learning or predictive analytics features
- Limited export options of visualizations and reports
- Data security concerns may arise as data is stored on Chartio's servers.

Things You Didn't Know About Chartio
Chartio is a cutting-edge data analytics tool that provides businesses with powerful insights and visualizations to help them understand their data better. It is designed for teams that need to explore and analyze their data in real-time, and it offers a range of features that make it easier to uncover insights and share them with others.
One of the key features of Chartio is its powerful query editing capabilities. With this tool, you can easily create complex queries and analyze your data in real-time. This makes it much easier to identify trends, patterns, and anomalies in your data, which can be critical for making informed business decisions.
Another great feature of Chartio is its exploration dashboards. These dashboards provide a visual representation of your data, making it easy to identify trends and patterns quickly. This allows you to see your data in a way that is intuitive and easy to understand, which can be especially helpful for non-technical users.
Chartio also includes built-in alerts that allow you to set up notifications when certain conditions are met. For example, you can set up alerts to notify you when sales exceed a certain threshold or when inventory levels fall below a specific point. This can help you stay on top of critical business metrics and take action when needed.
Finally, Chartio offers instant collaboration features that make it easy to share your data and insights with others on your team. You can easily share charts, dashboards, and reports with others, allowing everyone to stay on the same page and make informed decisions based on the latest data.
In summary, Chartio is a powerful data analytics tool that provides teams with the insights and visualizations they need to explore and analyze their data. Whether you're a data analyst, marketer, or business owner, Chartio can help you make better decisions and drive better outcomes for your business.
Get in touch with Chartio

edited by
John Smith is a freelance writer with over a decade of writing experience in the tech industry. John is not just a writer, but also a geek and developer who has a passion for exploring new AI-powered tools and GPT-3 & GPT-4 apps. He is an enthusiast in the field of artificial intelligence and regularly writes about the latest advancements in the industry. When John is not writing, you can find him tinkering with new coding languages or spending time with his family. His mission is to bridge the gap between technology and the everyday user through his writing.


