 New
New
 Free
Free
 Home
Home

Datawatch is an innovative platform that empowers users to prepare, visualize, and analyze big data with ease. The self-service solution provides a user-friendly interface that facilitates the discovery of insights and trends hidden in large datasets. With its powerful data preparation features, Datawatch enables businesses to streamline their data management processes and make better decisions based on accurate and reliable information. Whether you are a data scientist or a business professional, Datawatch can help you unlock the value of your data and gain a competitive advantage in today's data-driven world.
Usage: Data
Pricing: Freemium - Free/Premium/Enterprise Plans
Tags: platform analyze big data competitive advantage data preparation
For more information, jump to:
Screenshots | Videos | Similar Tools | FAQs | Pros and Cons | Facts


Product Screenshots
Video Reviews
Similar Tools to Datawatch
-
Jonda is a secure patient health data management platform to empower patients with their health data. Scan and upload medical records by simply taking a photo or upload a document directly from your files and we will do the rest using intelligent systems.
 Contact for Rates
#Database
Contact for Rates
#Database
-
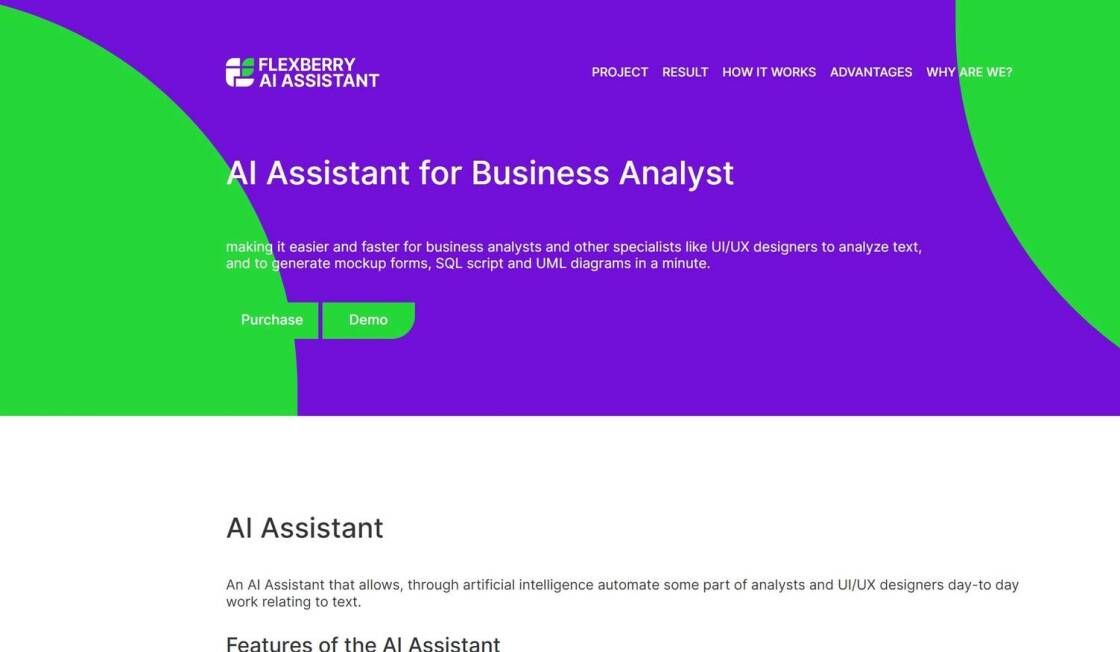
Flexberry AI Assistant is a cutting-edge solution that streamlines the requirement processing and artifact generation process for business analysts. This innovative tool, known as Flexberry, harnesses the power of artificial intelligence to automate and enhance various aspects of this critical workflow. By leveraging advanced algorithms and machine learning capabilities, Flexberry AI Assistant enables businesses to efficiently analyze and interpret complex requirements, resulting in accurate and tailored artifact generation. With its user-friendly interface and intelligent automation, Flexberry revolutionizes the way business analysts operate, increasing productivity and consistency while reducing the risk of errors.
Contact for Rates
#Database
-
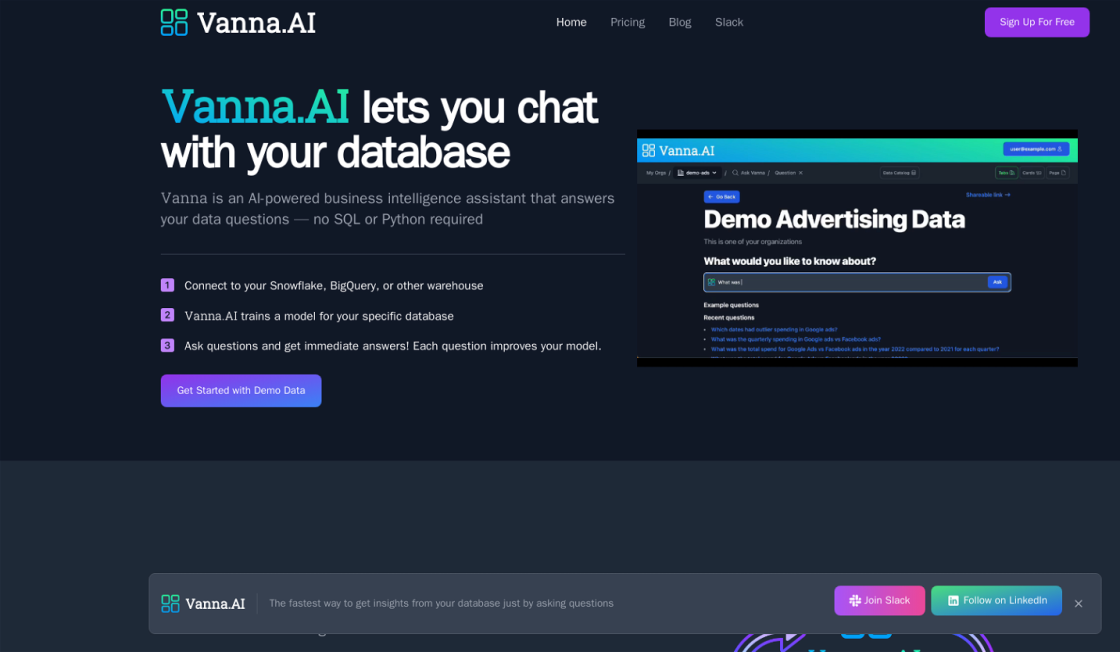
Introducing Vanna, the AI-powered business intelligence assistant that simplifies data analysis. With Vanna, you can quickly connect to your database and retrieve insights using natural language processing technology. It eliminates the need for SQL or Python queries, allowing you to ask questions in plain English. Whether you use Snowflake, BigQuery, or any other database, Vanna makes understanding your data a breeze. Say goodbye to hours of writing complex queries and say hello to quick and efficient data analysis with Vanna.
Free
#Database
-
Wizdom.ai is an innovative tool that utilizes the power of Artificial Intelligence to generate in-depth insights related to research trends, institutes, countries, journals, and funding bodies. With its state-of-the-art algorithms, Wizdom.ai helps researchers to stay updated with the latest developments in their fields, identify emerging trends, and track the performance of various institutions and funding bodies. Moreover, this AI-powered tool provides a comprehensive analysis of the scientific literature, enabling researchers to make data-driven decisions and produce high-quality research outputs. Overall, Wizdom.ai is a game-changer for the research industry, providing valuable insights that can drive innovation and progress in various fields.
Contact for Rates
#Database
-
InterSystems IRIS is a powerful data platform that is transforming the healthcare and financial services industries, as well as other mission-critical applications. This innovative technology provides a comprehensive solution for managing and analyzing large amounts of data, helping organizations to make informed decisions and achieve their goals more effectively. With its advanced features and capabilities, InterSystems IRIS is quickly becoming the go-to platform for businesses looking to stay ahead of the curve in today's rapidly evolving digital landscape. Whether you're looking to improve patient care, streamline financial operations, or optimize other critical processes, InterSystems IRIS has the tools you need to succeed.
Contact for Rates
#Database
-
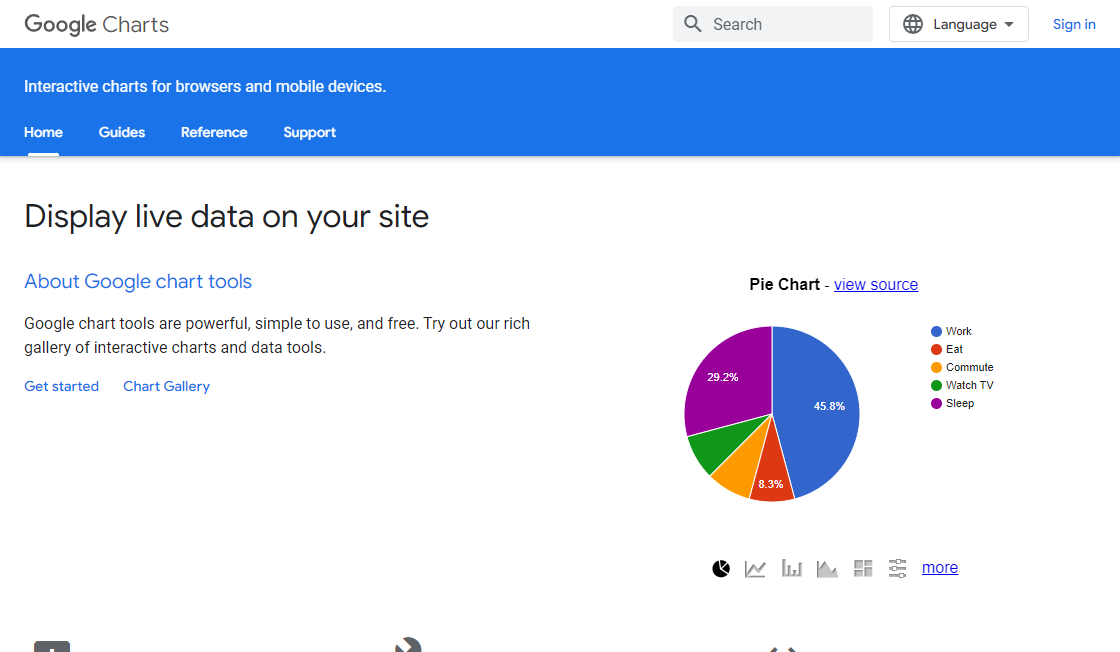
Google Charts is an exceptional tool that allows users to create interactive charts that are both free and easy to use. It is a powerful tool that provides users with a wide range of features and customization options to create visually appealing charts. With its simple and intuitive interface, Google Charts enables users to create charts that can be embedded in websites, applications, or presentations. Its versatility makes it an ideal tool for businesses, educators, and researchers alike, who can use it to present data in a visually engaging way. Overall, Google Charts is a must-have tool for anyone looking to create interactive charts.
Free
#Database

Top Rated Tools
-
ChatGPT Plus
Introducing ChatGPT
Contact for Rates #Alternative Language Model -
Repl.it
Replit: the collaborative browser based IDE - Replit
Free #Code Assistant -
Media.io
Media.io - Online Free Video Editor, Converter, Compressor
Contact for Rates #Image Editing -
Klaviyo SMS Assistant
SMS Assistant AI Text Messages | Klaviyo Product Features
Paid #Sales Assistant -
WatermarkRemover.io
Watermark Remover - Remove Watermarks Online from Images for Free
Freemium #Image Editing -
Date Night Short Film
AI Generated Script: How We Made a Movie With AI | Built In
Contact for Rates #Writing Assistant -
Make (fomerly Known As Integromat)
Automation Platform
Contact for Rates #Automation -
Psychedelic Visual Interpretations Of Famous Poems
This bizarro AI creates psychedelic visual interpretations of famous poems
Contact for Rates #Poetry


In today's data-driven world, businesses and organizations are constantly seeking innovative ways to extract insights from the vast amounts of data available to them. Datawatch is a self-service data preparation, data visualization, and analytics platform that has emerged as a viable solution to help users unlock the value in big data. With its user-friendly interface and powerful analytical tools, Datawatch allows users to quickly and easily manipulate large datasets, visualize complex information, and generate actionable insights. By doing so, organizations can make informed decisions that drive growth and profitability. The platform is designed to be flexible and scalable, making it suitable for businesses of all sizes and industries. With Datawatch, users can streamline their data preparation process, improve data accuracy, and reduce time-to-insight. This introduction will provide an overview of Datawatch, highlighting its key features and benefits, and explore why it has become one of the most popular self-service data preparation and analytics platforms on the market today.

Top FAQ on Datawatch
1. What is Datawatch?
Datawatch is a self-service data preparation, data visualization, and analytics platform that helps users unlock the value in big data.
2. How does Datawatch work?
Datawatch enables users to connect to disparate data sources, prepare data for analysis and create interactive visualizations without requiring IT assistance.
3. What are the benefits of using Datawatch?
Datawatch allows users to analyze large datasets quickly and easily, identify trends and patterns, and make data-driven decisions.
4. Who can use Datawatch?
Datawatch is designed for business analysts, data scientists, and other professionals who need to analyze large datasets to make informed decisions.
5. What types of data sources can be connected to Datawatch?
Datawatch can connect to a wide range of data sources, including databases, spreadsheets, cloud services, and web APIs.
6. Can Datawatch handle real-time data?
Yes, Datawatch can connect to real-time data sources and provide real-time analytics.
7. Does Datawatch require programming skills?
No, Datawatch is a self-service platform that does not require programming skills to use.
8. What types of visualizations can be created with Datawatch?
Datawatch allows users to create a wide range of interactive visualizations, including charts, graphs, maps, and dashboards.
9. How does Datawatch ensure data security?
Datawatch provides robust security features, including role-based access control, data encryption, and audit trails.
10. Is Datawatch customizable?
Yes, Datawatch is highly customizable and can be tailored to meet the specific needs of each user or organization.
11. Are there any alternatives to Datawatch?
| Competitor | Description | Difference |
|---|---|---|
| Tableau | Tableau is a data visualization tool that helps people see and understand their data. It offers a wide range of business intelligence solutions, including data preparation, data analysis, and dashboard creation. | Datawatch focuses on self-service data preparation while Tableau is primarily a data visualization tool. Tableau also has a larger number of integrations with other tools, making it easier to connect with other data sources. |
| Alteryx | Alteryx is a self-service data analytics software that provides users with tools to prepare, blend, and analyze data. It offers a wide range of features such as predictive analytics, data cleansing, and data visualization. | Alteryx is more focused on data analytics and does not provide as much emphasis on data visualization compared to Datawatch. Alteryx also has a steeper learning curve and requires more technical expertise to operate. |
| QlikView | QlikView is a business intelligence platform that enables users to create interactive reports and dashboards. It offers a wide range of features such as data visualization, data preparation, and data discovery. | QlikView has more emphasis on data discovery compared to Datawatch. QlikView also offers more advanced data analytics features and has a larger user community, making it easier to get support and find resources online. |
| Microsoft Power BI | Microsoft Power BI is a cloud-based business analytics service that provides interactive visualizations and business intelligence capabilities with an interface simple enough for end users to create their own reports and dashboards. | Microsoft Power BI has more emphasis on integrating with other Microsoft products and has a larger number of integrations with other tools compared to Datawatch. Power BI also offers more advanced data analytics features, but may require more technical expertise to operate. |
| Google Data Studio | Google Data Studio is a web-based data visualization tool that allows users to create interactive reports and dashboards. It offers a wide range of features such as data connectors, data visualization, and collaboration tools. | Google Data Studio has more emphasis on collaboration tools compared to Datawatch. It also offers more advanced data connectors, making it easier to connect with other data sources. However, Datawatch has more emphasis on self-service data preparation, making it easier for non-technical users to clean and transform data. |
| SAP Analytics Cloud | SAP Analytics Cloud is a cloud-based analytics platform that integrates BI, planning, and predictive analytics in one solution. It offers a wide range of features such as data modeling, data visualization, and augmented analytics. | SAP Analytics Cloud has more emphasis on predictive analytics and AI-powered insights compared to Datawatch. It also has more advanced data modeling capabilities, making it easier to create complex data models. However, Datawatch has more emphasis on self-service data preparation, making it easier for non-technical users to clean and transform data. |
| TIBCO Spotfire | TIBCO Spotfire is a data visualization and analytics software that provides users with tools to create interactive dashboards and reports. It offers a wide range of features such as data preparation, data discovery, and data visualization. | TIBCO Spotfire has more emphasis on data discovery and data analytics compared to Datawatch. It also offers more advanced data connectors, making it easier to connect with other data sources. However, Datawatch has more emphasis on self-service data preparation, making it easier for non-technical users to clean and transform data. |
| Looker | Looker is a business intelligence and analytics platform that enables users to create custom reports and dashboards. It offers a wide range of features such as data modeling, data visualization, and data exploration. | Looker has more emphasis on data modeling compared to Datawatch. It also has more advanced data exploration capabilities, making it easier to analyze large datasets. However, Datawatch has more emphasis on self-service data preparation, making it easier for non-technical users to clean and transform data. |

Pros and Cons of Datawatch
Pros
- Self-service platform enables users to work independently without IT support
- Data preparation tools make it easy to clean and transform data
- Analytics capabilities allow for deeper insights and data-driven decision making
- Real-time visualizations help users understand and communicate data findings quickly
- Integration with various data sources, including structured and unstructured data
- Flexible deployment options, including cloud, on-premises, and hybrid solutions
- Scalable architecture can handle large volumes of data
- User-friendly interface makes it easy for non-technical users to work with data
- Advanced features such as predictive analytics and machine learning algorithms for more sophisticated analysis
- Cost-effective solution compared to hiring a team of data scientists or outsourcing data analysis.
Cons
- Steep learning curve for beginners
- Limited customization options for charts and graphs
- Expensive pricing plans for enterprise-level features
- Requires technical knowledge to integrate with other systems
- Lack of advanced statistical analysis capabilities compared to other analytics platforms
- Limited data storage capacity for large datasets
- Limited collaboration and sharing features for team projects
- Not suitable for real-time data monitoring and analysis.

Things You Didn't Know About Datawatch
Datawatch is a powerful platform designed for self-service data preparation, visualization, and analytics. It is an excellent tool for unlocking the value of big data and analyzing it effectively. Here are some essential things you should know about Datawatch:
1. Self-Service Data Preparation
Datawatch provides users with self-service data preparation capabilities, which enables them to access, clean, and transform data without relying on IT teams. This feature makes it easy for anyone to use the platform regardless of their technical expertise.
2. Data Visualization
Datawatch offers a wide range of visualization options that help users create insightful and engaging reports. Users can choose from various chart types and customize them to meet their specific needs. The platform also allows users to create interactive dashboards that enable them to drill down into the data and discover insights.
3. Analytics
Datawatch's analytics capabilities allow users to analyze data in real-time and make data-driven decisions quickly. With its advanced algorithms and statistical models, users can identify trends, patterns, and outliers in their data, helping them gain a deeper understanding of their business operations.
4. Integration
Datawatch integrates seamlessly with other tools and platforms, allowing users to access data from multiple sources. The platform supports a wide range of data formats, including structured, semi-structured, and unstructured data.
5. Security
Datawatch takes data security seriously and provides users with robust security features to ensure their data is safe. The platform offers user authentication, authorization, and encryption capabilities, ensuring that only authorized users can access sensitive data.
In conclusion, Datawatch is an excellent platform for self-service data preparation, visualization, and analytics. Its ease of use, integration capabilities, and security features make it an ideal choice for businesses looking to unlock the value of big data.

edited by
Mark Roberts is a seasoned writer with over 15 years of experience in the world of freelance writing. Mark has worked with various clients across different industries and is well-versed in crafting engaging content that resonates with his audience. As a tech enthusiast, Mark has a keen interest in AI-powered tools and GPT-3 & GPT-4 apps, and is always on the lookout for new ways to integrate these tools into his work. Mark is a self-confessed geek and loves nothing more than getting lost in a good book or tinkering with new software. When he's not writing, Mark can be found honing his skills as a developer and working on his latest side project.


