 New
New
 Free
Free
 Home
Home

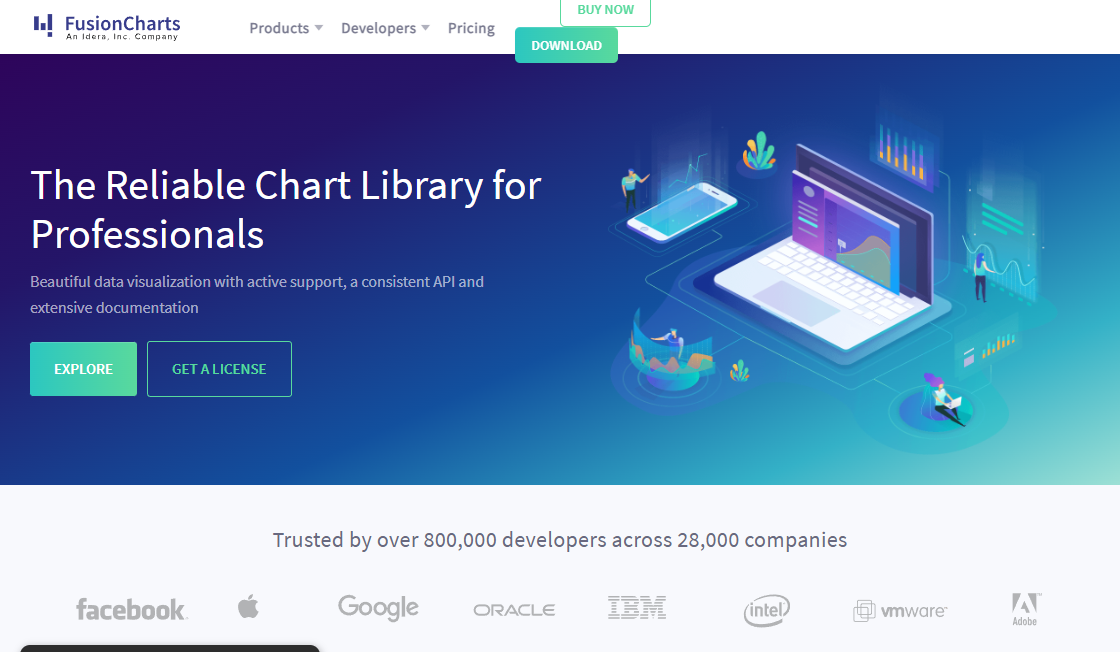
FusionCharts is a powerful JavaScript charting library that provides developers with an easy-to-use tool for creating interactive and static charts. With its user-friendly interface and versatile features, FusionCharts has become a popular choice among web developers looking to add visual representations of data to their applications. Whether you need to create simple bar charts or more complex visualizations like heat maps and treemaps, FusionCharts makes it easy to integrate and customize your charts to meet your specific needs.
Usage: Data
Pricing: Contact for Rates - Free/Paid plans
Tags: data JavaScript web developers visual representations versatile features
For more information, jump to:
Screenshots | Videos | Similar Tools | FAQs | Pros and Cons | Facts


Product Screenshots
Video Reviews
Similar Tools to FusionCharts
-
Uncovered is the largest public database of cold case information and a suite of tools that enable the massive true crime community to turn their interest into advocacy.
 Contact for Rates
#Database
Contact for Rates
#Database
-
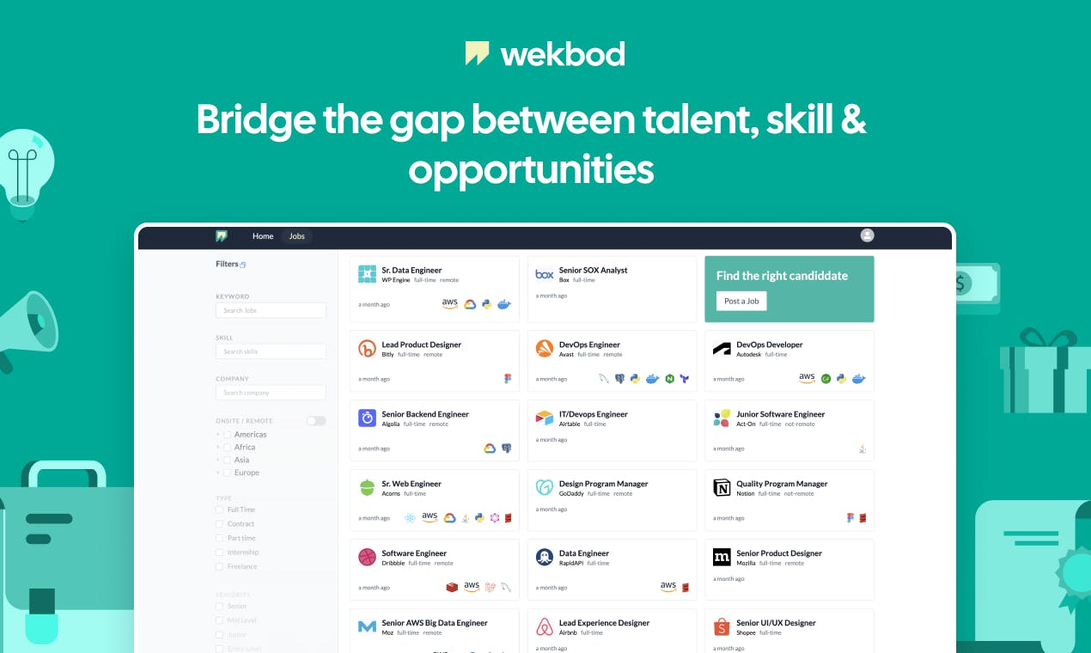
Those days when I was seeking for a Job, I made a database of companies, jobs, and other metadata, fast forward to a few months, and I made that database into an App for other people to curate info about their Job seeking process. I hope you find Value...
Free
#Database
-
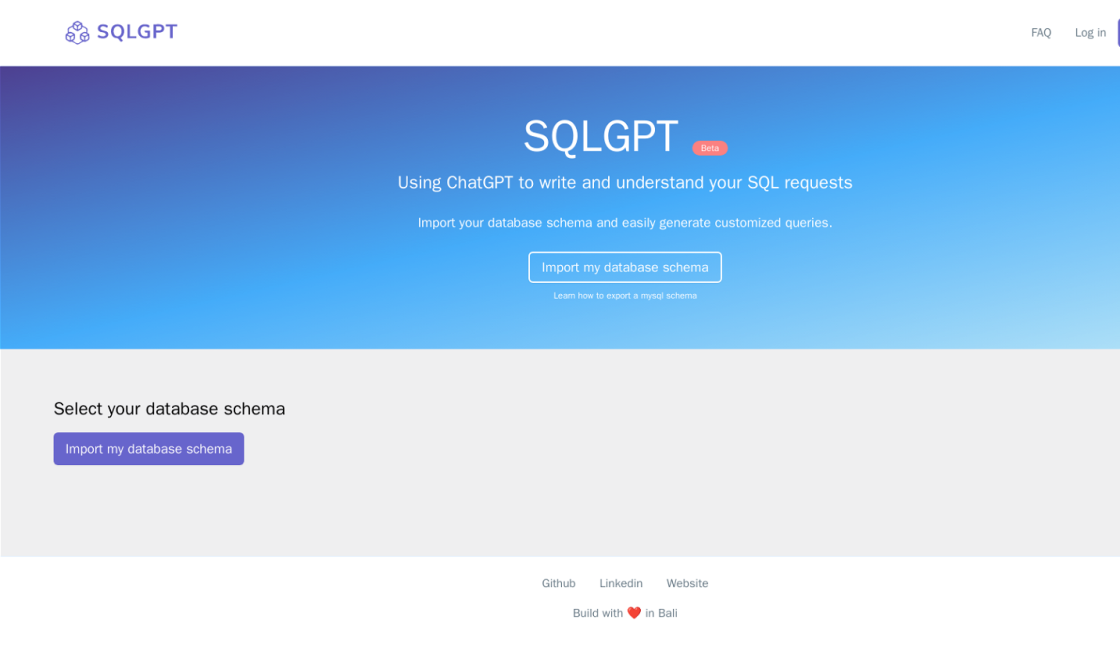
SQLGPT is an innovative AI tool that has revolutionized the way SQL requests are written and understood. The tool uses ChatGPT to assist users in writing and comprehending SQL requests. With SQLGPT, users can receive expert guidance and support, enabling them to enhance their database management skills. This revolutionary tool is designed to simplify the complex world of database management and provides a hassle-free experience to its users. SQLGPT is an essential resource for anyone seeking to improve their database management skills and optimize their data analysis capabilities.
Contact for Rates
#Database
-
RapidMiner Studio is a cutting-edge AI platform designed specifically for data science teams. This platform is equipped with advanced capabilities and analytical tools that enable professionals to analyze large datasets and extract valuable insights. RapidMiner Studio is favored by many data scientists due to its flexibility, user-friendliness, and ability to integrate with other tools. It is a reliable solution for businesses looking to make data-driven decisions and gain a competitive edge in the market.
Contact for Rates
#Database
-
Sumo Logic is a cloud-based logging and analytics platform that enables organizations to gain real-time insights into their infrastructure and applications. With its advanced machine learning algorithms and scalable architecture, Sumo Logic provides businesses with unparalleled visibility into their operations, helping them to troubleshoot issues, optimize performance, and improve security. The platform supports a wide range of log sources, including servers, containers, network devices, and cloud services, making it an ideal solution for modern, hybrid IT environments. By leveraging Sumo Logic, organizations can stay ahead of the curve and drive their digital transformation initiatives forward.
Contact for Rates
#Database
-
The age of Artificial Intelligence (AI) has changed the way we do business, and it's also transformed the customer experience. AI-driven personalization is a powerful tool for businesses, banks, and merchants to use for better customer experiences. With AI-driven personalization, customers can expect faster and more personalized service, banks can offer better products and services, and merchants can gain more customers and increase their revenue. This innovative technology, known as Maya, is revolutionizing the way businesses, banks, and merchants interact with their customers. Everyone wins when they embrace AI-driven personalization, and Maya is leading the way.
Paid
#Customer Service

Top Rated Tools
-
Stable Diffusion Photoshop Plugin
Explore the best Photoshop apps - Adobe Photoshop
Contact for Rates #Design Assistant -
ControlNet
AI-Powered Industrial IoT Platform
Contact for Rates #Text Editing -
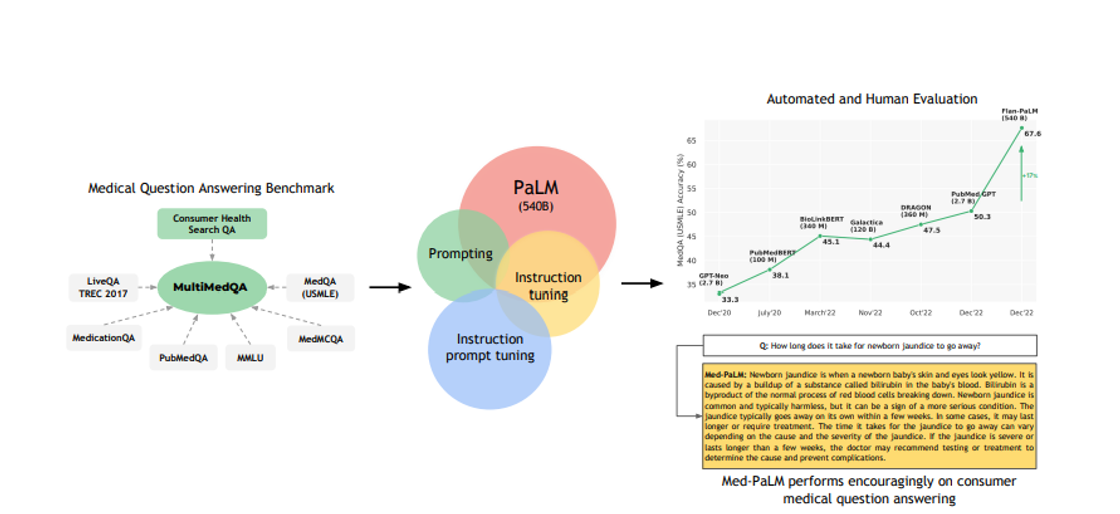
Med-PaLM
AI Powered Medical Imaging
Contact for Rates #Alternative Language Model -
Ghostwriter
Ghostwriter - Code faster with AI - Replit
Paid #Creative Writing -
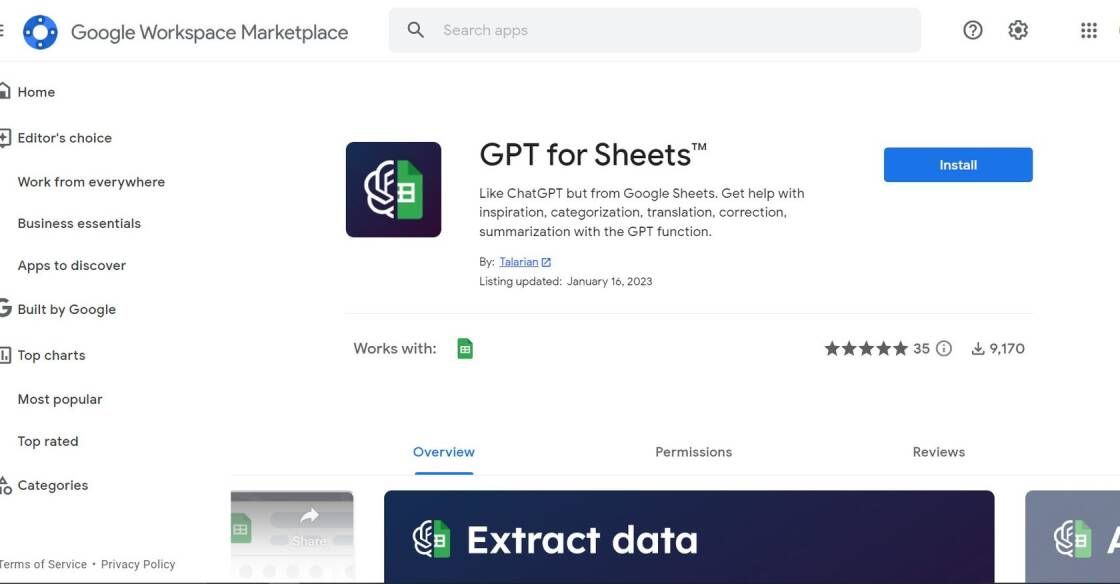
GPT For Sheets
GPT for Sheets™ and Docs™ - Google Workspace Marketplace
Free #Generative AI -
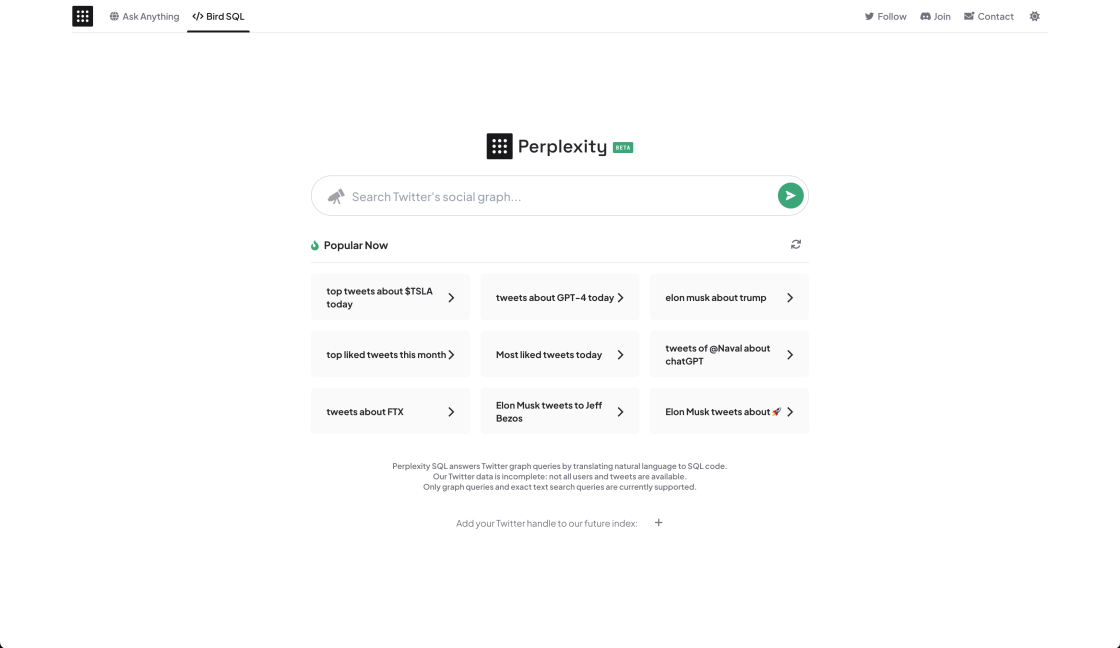
Perplexity AI: Bird SQL
A Twitter search interface that is powered by Perplexity’s structured search engine
Contact for Rates #Search Engine -
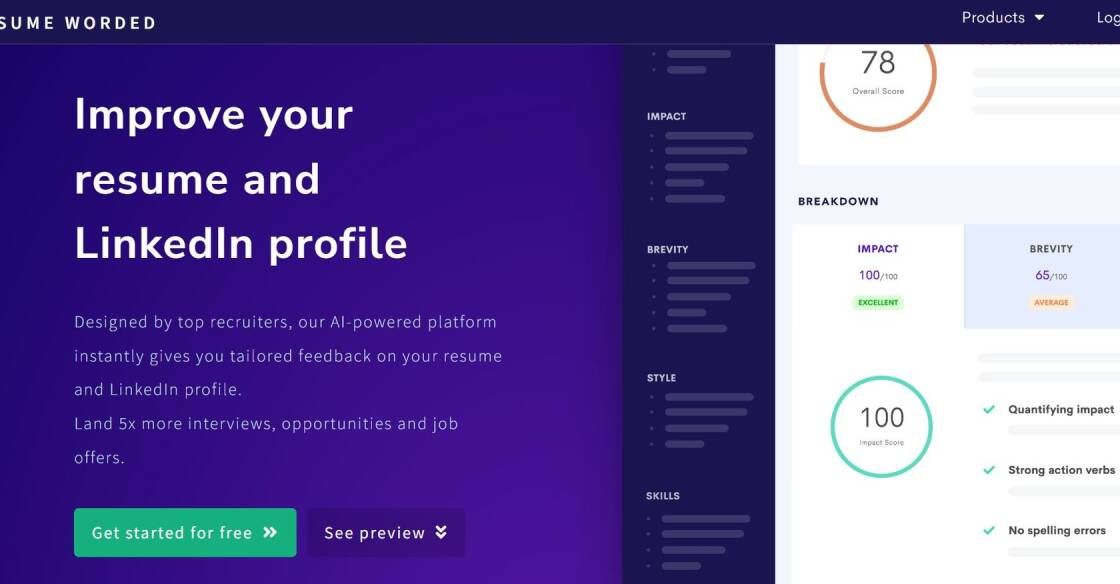
Resume Worded
Resume Worded - Free instant feedback on your resume and LinkedIn profile
Free #Life Assistant -
Palette.fm
AI Generated Music for Your Projects
Freemium #Image Editing


FusionCharts is a popular JavaScript charting library that has gained widespread popularity among developers due to its ease of integration and versatility. It is capable of creating both interactive and static charts, making it a powerful tool for data visualization. FusionCharts provides a wide range of chart types, including line, area, column, bar, pie, and more. The library comes equipped with a comprehensive API that enables developers to customize the charts to suit their specific needs. With its intuitive and user-friendly interface, FusionCharts has become a go-to solution for businesses and organizations looking to present data in a clear and visually appealing manner. Whether you are a beginner or an experienced developer, FusionCharts is an excellent choice for creating dynamic and engaging charts that will help you communicate your data effectively.

Top FAQ on FusionCharts
1. What is FusionCharts?
FusionCharts is a JavaScript charting library used to create both interactive and static charts.
2. How can FusionCharts be integrated?
FusionCharts can be easily integrated into any web application or website with the help of simple JavaScript code.
3. What type of charts can be created using FusionCharts?
FusionCharts can be used to create a wide range of charts, including column, bar, line, area, pie, doughnut, and more.
4. What is the level of interactivity supported by FusionCharts?
FusionCharts supports a high level of interactivity, allowing users to zoom, pan, hover, click, and select data points on the charts.
5. Can FusionCharts be used for real-time data visualization?
Yes, FusionCharts can be used to visualize real-time data by updating charts dynamically.
6. Is FusionCharts mobile-friendly?
Yes, FusionCharts is designed to work on all devices, including desktops, laptops, tablets, and smartphones.
7. Does FusionCharts support multiple languages?
Yes, FusionCharts supports over 100 languages, making it easy to create charts in different languages.
8. What type of data sources can be used with FusionCharts?
FusionCharts can be used with a wide range of data sources, including JSON, XML, CSV, and Excel spreadsheets.
9. Does FusionCharts offer customization options?
Yes, FusionCharts offers a variety of customization options, including chart themes, colors, fonts, and more.
10. Is there any technical support available for FusionCharts?
Yes, FusionCharts provides technical support through email, phone, and online chat. They also offer extensive documentation and tutorials to help users get started.
11. Are there any alternatives to FusionCharts?
| Competitor Name | Description | Key Features | Price |
|---|---|---|---|
| Highcharts | A popular JavaScript charting library that offers a wide range of chart types and customization options. | Interactive charts, extensive documentation, responsive design | Free for non-commercial use, paid plans starting at $390/year |
| Google Charts | A charting library developed by Google that offers a variety of chart types and integration with other Google products. | Dynamic data integration, real-time collaboration, responsive design | Free |
| Chart.js | A lightweight charting library that uses HTML5 canvas to create dynamic and responsive charts. | Easy to use, customizable, responsive design | Free |
| D3.js | A powerful data visualization library that allows for more complex visualizations and custom designs. | Advanced data manipulation, interactive visualizations, open source | Free |
| Plotly | A web-based charting and data visualization tool that offers interactive charts and sharing options. | Online collaboration, multiple output formats, dynamic dashboards | Free for basic usage, paid plans starting at $19/month |

Pros and Cons of FusionCharts
Pros
- Easy integration with web applications.
- Ability to create both interactive and static charts.
- Large number of chart types available.
- Customizable chart appearance.
- Responsive design for mobile devices.
- Cross-browser compatibility.
- Support for real-time data streaming.
- Support for multiple data sources.
- Comprehensive documentation and support.
Cons
- There may be a learning curve for those who are new to JavaScript and charting libraries.
- The library may not be suitable for very complex or customized charting needs.
- FusionCharts may not be the most cost-effective option for small-scale projects or individuals.
- It may not be as widely recognized or widely used as other charting libraries, potentially limiting community support and resources.
- Depending on the specific project requirements, there may be better-suited alternatives available.

Things You Didn't Know About FusionCharts
FusionCharts is a leading JavaScript charting library that allows developers to create interactive and static charts with ease. It is widely used by businesses, data analysts, and developers to represent complex data in an easy-to-understand format.
Here are some essential things you should know about FusionCharts:
1. Easy to Integrate: FusionCharts can be easily integrated with various programming languages such as JavaScript, PHP, ASP.NET, Ruby on Rails, etc. You can also integrate it with popular frameworks like Angular, React, Vue.js, and others.
2. Wide Range of Chart Types: With over 100 chart types and 2,000+ data-driven maps, FusionCharts provides a wide range of chart types that cater to different data visualization needs. You can create interactive charts like line charts, bar charts, pie charts, gauges, and more.
3. Customizable: FusionCharts provides extensive customization options to help you create charts that match your brand’s look and feel. You can customize colors, fonts, background, labels, and more. Additionally, you can add your own logo or background image to your charts.
4. Interactive: FusionCharts allows users to create interactive charts that encourage users to engage with the data. You can add tooltips, zooming, panning, drill-downs, and other interactive features to your charts.
5. Mobile-friendly: FusionCharts is designed to be mobile-friendly, ensuring that your charts look great on various devices. You can use responsive design or create separate charts for desktop and mobile devices.
6. Fast and Efficient: FusionCharts is optimized for performance, ensuring that your charts load fast and behave smoothly even with large datasets. It uses modern web technologies like SVG and Canvas to provide high-quality charts.
In conclusion, FusionCharts is an excellent charting library for developers who want to create interactive and static charts quickly and easily. With its wide range of chart types, customization options, and interactive features, FusionCharts is a must-have tool for any data analyst or business that wants to make data-driven decisions.

edited by
Mark Roberts is a seasoned writer with over 15 years of experience in the world of freelance writing. Mark has worked with various clients across different industries and is well-versed in crafting engaging content that resonates with his audience. As a tech enthusiast, Mark has a keen interest in AI-powered tools and GPT-3 & GPT-4 apps, and is always on the lookout for new ways to integrate these tools into his work. Mark is a self-confessed geek and loves nothing more than getting lost in a good book or tinkering with new software. When he's not writing, Mark can be found honing his skills as a developer and working on his latest side project.


