 New
New
 Free
Free
 Home
Home

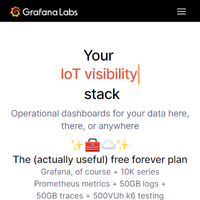
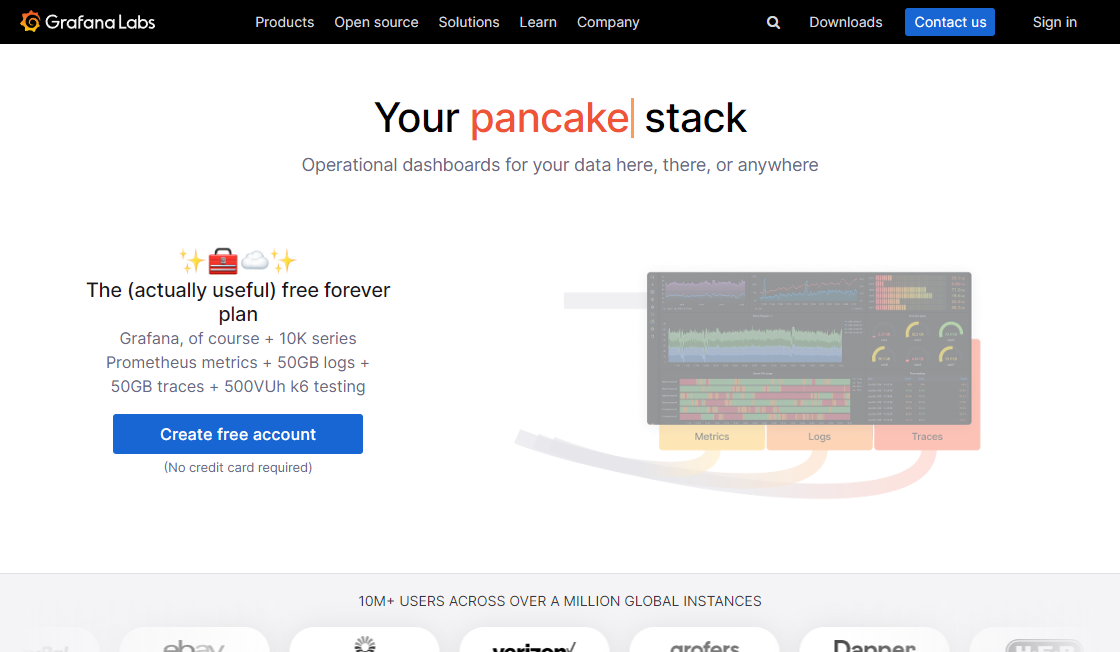
Grafana is a powerful, open source solution for visualizing and analyzing metrics data from a variety of sources. With support for Graphite, Elasticsearch, OpenTSDB, Prometheus and InfluxDB, Grafana offers a feature-rich dashboard and graph editor that makes it easy to explore and understand complex data sets. Whether you're tracking performance metrics, analyzing system logs or monitoring network traffic, Grafana provides a flexible, customizable platform for data visualization and analysis. With its intuitive interface and extensive library of plugins and integrations, Grafana is a valuable tool for anyone looking to gain insights and make data-driven decisions.
Usage: Data
Pricing: Free - Free
Tags: visualization dashboard Elasticsearch Prometheus metrics data
For more information, jump to:
Screenshots | Videos | Similar Tools | FAQs | Pros and Cons | Facts | Contact Info


Product Screenshots
Video Reviews
Similar Tools to Grafana
-
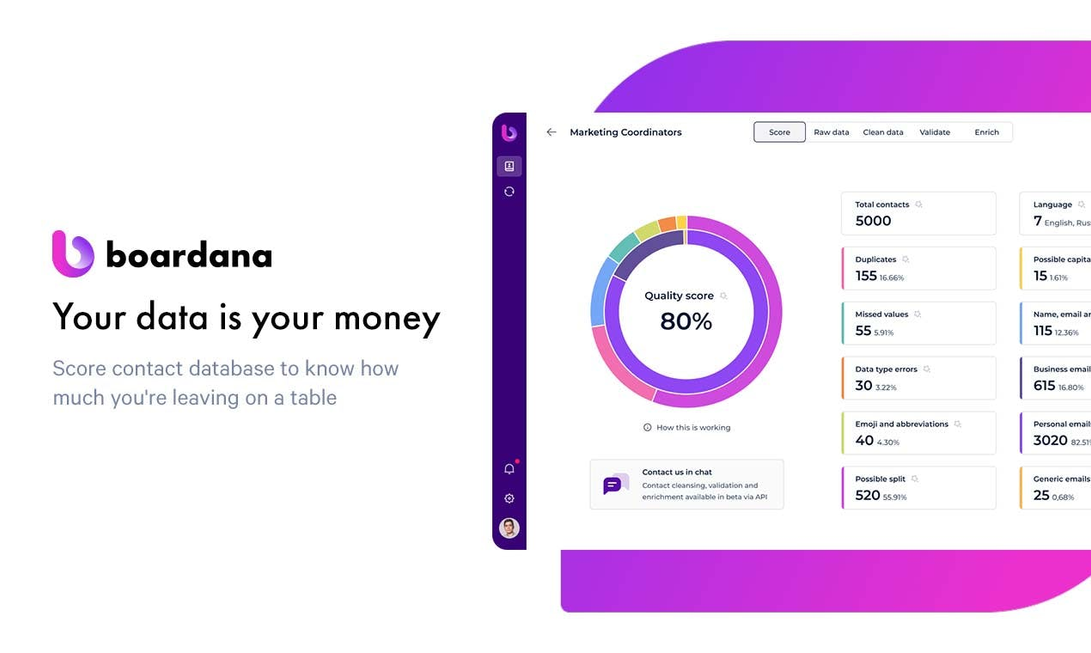
Boardana scores a contact database on possible errors in names, emails, and phones, and identifies duplicates, emojis, abbreviations, etc. Boardana has automatic contact cleaning, email&phone validation, and enrichment available in beta, and all-in-one API.
 Free
#Database
Free
#Database
-
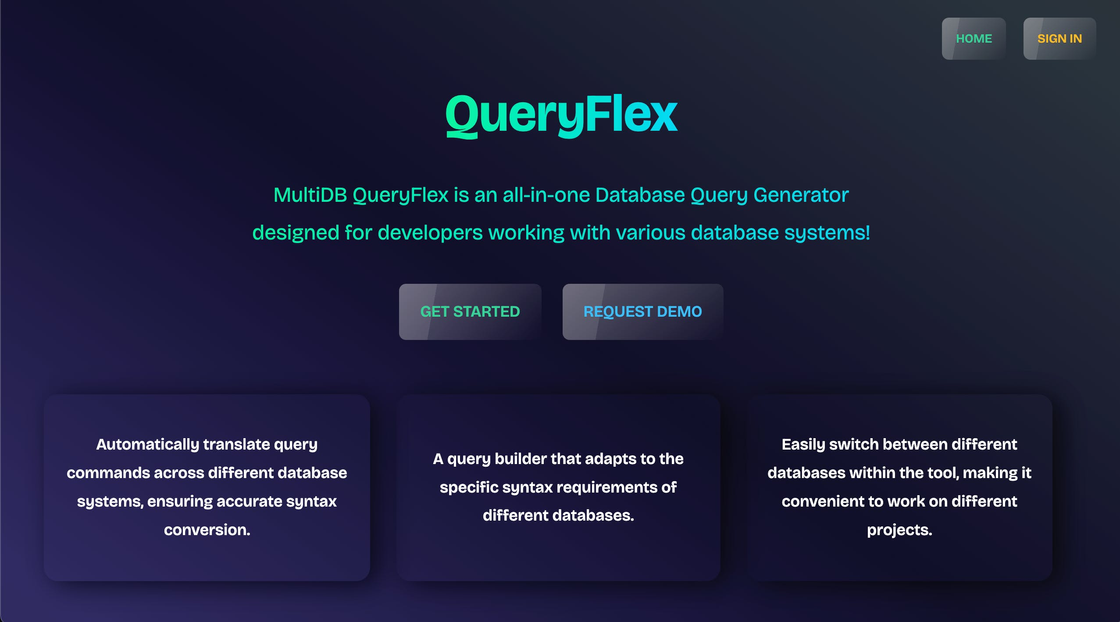
MultiDB QueryFlex is an all-in-one Database Query Generator designed for developers working with various database systems like SQL, PostgreSQL, Firebase, MongoDB, Prisma, or other platforms.
Free
#Database
-
Real Estate Digital (RED) is a platform that offers data-driven solutions and services to the real estate industry. With RED, businesses in the real estate industry can access comprehensive data insights and analytics, allowing them to make informed decisions that drive growth and profitability. Through its user-friendly interface, RED provides a range of services, including market analysis, property valuation, and real-time data feeds, making it an essential tool for investors, developers, lenders, and other real estate professionals. With its advanced technology and cutting-edge features, RED is revolutionizing the way the real estate industry operates, providing unparalleled access to critical information and empowering businesses to succeed in a highly competitive market.
Contact for Rates
#Database
-
Alteryx Predictive Analytics is an advanced predictive analytics platform powered by artificial intelligence that enables businesses to gain valuable insights into their data. By leveraging cutting-edge algorithms, this platform empowers organizations to analyze and visualize their data with ease. With Alteryx Predictive Analytics, businesses can make data-driven decisions, predict future trends, and achieve a competitive edge in the market. This platform offers a comprehensive suite of tools that enable users to explore, model, and deploy predictive models quickly and efficiently. In this article, we will explore the features and benefits of Alteryx Predictive Analytics and how it can help businesses unlock the potential of their data.
Contact for Rates
#Database
-
Hebbia is a revolutionary AI-powered search engine that has been designed to streamline the process of finding relevant information. With its advanced algorithms and intelligent systems, Hebbia helps users quickly and efficiently find accurate answers to their queries. Whether you need to conduct market research or extract targeted information, the platform's AI Analyst understands your needs and provides personalized results. With its cutting-edge technology, Hebbia is set to transform the way we search for information online.
Contact for Rates
#Database
-
TruthfulQA is a new system that measures how accurately artificial intelligence (AI) models imitate human falsehoods. Developed by researchers at the University of Washington, this system uses deep learning algorithms to compare AI models with human responses and analyze their accuracy in capturing human deception. It provides a new way to measure the performance of AI models in producing responses that mimic the truthfulness of humans. With TruthfulQA, researchers can better understand when and why AI models fail to accurately mimic human behavior.
Contact for Rates
#Database


Top Rated Tools
-
Wolframalpha
Wolfram|Alpha: Computational Intelligence
Freemium #Knowledge Base -
Repl.it
Replit: the collaborative browser based IDE - Replit
Free #Code Assistant -
AI Time Machine
AI Time Machine™ : créez des avatars IA et voyagez dans le temps
Freemium #Avatar Generation -
LanguageTool
LanguageTool - Online Grammar, Style & Spell Checker
Freemium #Paraphrasing -
Wordtune
Wordtune | Your personal writing assistant & editor
Paid #Paraphrasing -
Perplexity AI
Building Smarter AI
Free #Chatgpt Alternative -
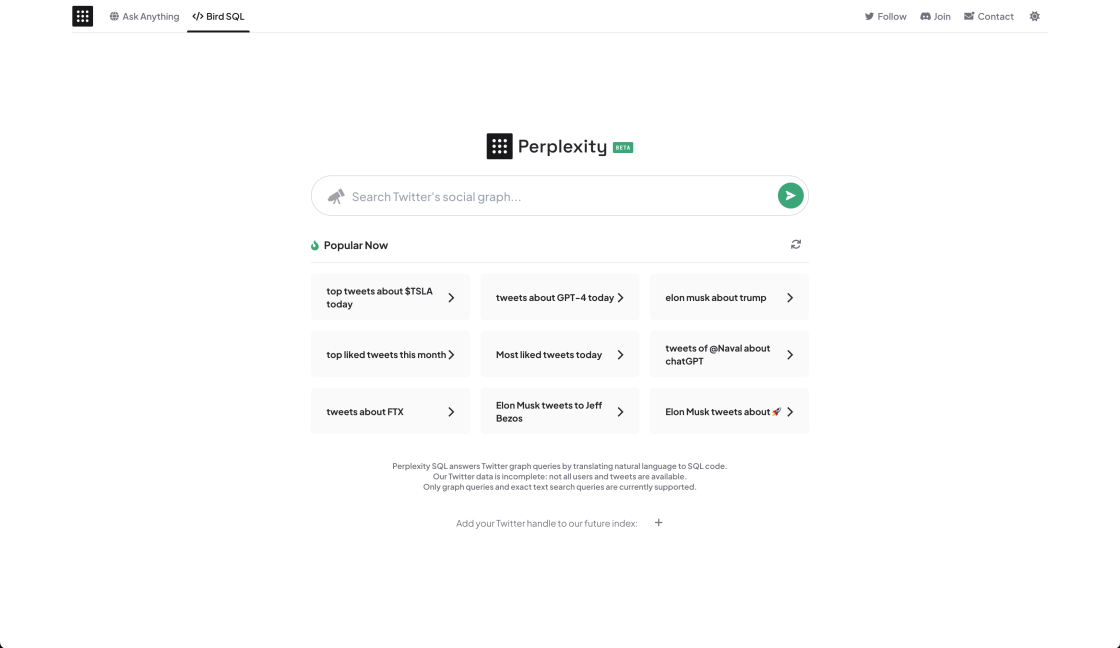
Perplexity AI: Bird SQL
A Twitter search interface that is powered by Perplexity’s structured search engine
Contact for Rates #Search Engine -
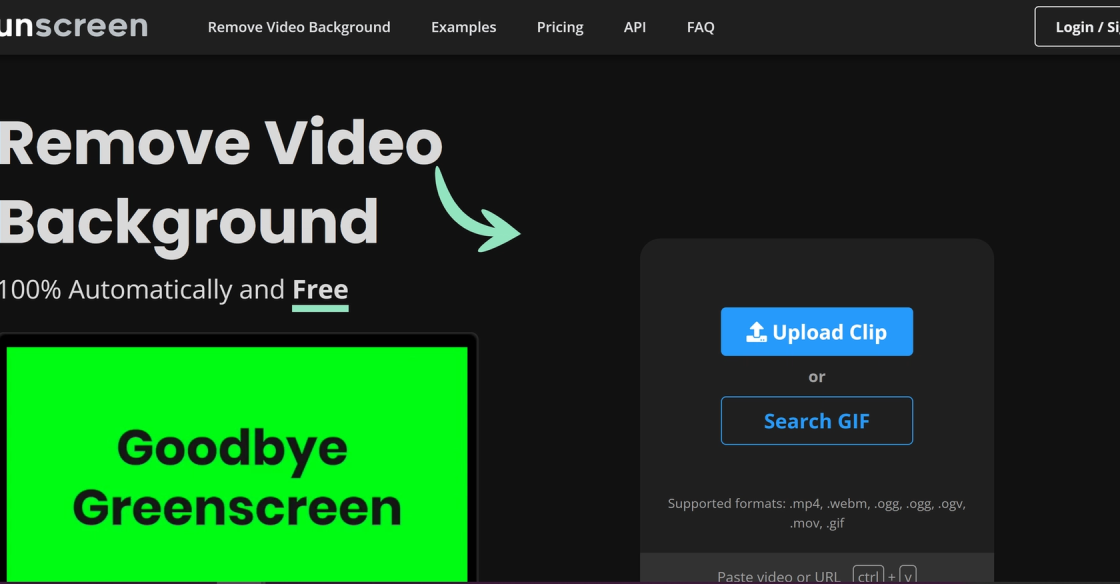
Unscreen
Remove Video Background – Unscreen
Paid #Image Editing


Grafana is a powerful and versatile open source metrics dashboard and graph editor designed to work with multiple data sources such as Graphite, Elasticsearch, OpenTSDB, Prometheus and InfluxDB. It offers a wide range of features that make it an ideal tool for monitoring and visualizing complex systems and applications. With Grafana, users can create beautiful, interactive and customizable dashboards that provide real-time insights into their data.
One of the key strengths of Grafana is its ability to integrate with a variety of data sources, making it a flexible and adaptable solution for organizations with diverse infrastructure needs. It also offers a robust set of visualization options, including heat maps, time series graphs, and tables, allowing users to explore and analyze data in a variety of ways.
In addition to its technical capabilities, Grafana has a vibrant community of developers and users who contribute to its ongoing development and support. This community-driven approach has helped to make Grafana one of the most popular and widely used metrics dashboards in the world. Whether you are a developer, system administrator or data analyst, Grafana is an essential tool for gaining valuable insights into your data.

Top FAQ on Grafana
1. What is Grafana?
Grafana is an open-source and feature-rich metrics dashboard and graph editor.
2. What are the features of Grafana?
Grafana has various features, including a customizable dashboard, support for multiple data sources, alerting, and graphing.
3. What types of data sources does Grafana support?
Grafana supports various data sources, such as Graphite, Elasticsearch, OpenTSDB, Prometheus, and InfluxDB.
4. Is Grafana free to use?
Yes, Grafana is an open-source tool that is free to use.
5. Can Grafana be used for monitoring purposes?
Yes, Grafana can be used for monitoring purposes with the help of its alerting and dashboard features.
6. Does Grafana offer integration with other tools?
Yes, Grafana offers integration with other tools such as Slack, PagerDuty, and more.
7. Can Grafana be used for data visualization?
Yes, Grafana is widely used for data visualization and analysis.
8. Is Grafana easy to install and use?
Yes, Grafana is easy to install and use, thanks to its user-friendly interface.
9. Can I customize my Grafana dashboard?
Yes, Grafana offers a highly customizable dashboard, allowing you to tailor it to your specific needs.
10. What is the main benefit of using Grafana?
The main benefit of using Grafana is its ability to provide real-time monitoring and analytics of data from multiple sources, enabling businesses to make data-driven decisions.
11. Are there any alternatives to Grafana?
| Competitor | Description | Key Features |
|---|---|---|
| Kibana | Open source data visualization plugin for Elasticsearch. | Data exploration, log analysis, visualizations, geospatial mapping. |
| Zabbix | Open source monitoring solution. | Network and application monitoring, alerting, data visualization. |
| Nagios | Open source monitoring system. | Network, server, and application monitoring, alerting. |
| Datadog | Cloud-based monitoring and analytics platform. | Infrastructure monitoring, APM, log management, collaboration tools. |
| Prometheus | Open source monitoring system and time series database. | Metrics collection, alerting, data visualization. |

Pros and Cons of Grafana
Pros
- Open source, meaning it's free to use and customizable
- Feature-rich metrics dashboard with a variety of data sources available
- Graph editor to create custom visualizations
- Supports popular data storage solutions such as Graphite, Elasticsearch, OpenTSDB, Prometheus, and InfluxDB
- Highly customizable, allowing users to tailor the dashboard to their specific needs
- User-friendly interface for easy navigation and manipulation of the data
- Offers alerts and notifications to keep users informed of important changes in their data
- Can be used for both real-time and historical data analysis
- Large community of users and developers, providing extensive support and resources.
Cons
- Steep learning curve for beginners
- Limited support for some data sources
- Not designed for complex data analysis
- Requires additional plugins for certain functionalities
- May consume significant system resources
- Limited customization options for certain features
- Limited documentation for some advanced features
- May require significant configuration for optimal performance
- May not be suitable for small-scale projects with limited data.

Things You Didn't Know About Grafana
Grafana is a popular open-source software that allows you to create rich and interactive dashboards for monitoring and visualizing data from various sources. It provides support for multiple data sources, including Graphite, Elasticsearch, OpenTSDB, Prometheus, and InfluxDB. Grafana offers a user-friendly interface for editing graphs and visualizations, which makes it easy for users to create custom dashboards that meet their specific requirements.
One of the main advantages of using Grafana is its flexibility. It allows you to customize your dashboard with a variety of widgets, such as graphs, tables, and alerts, which can be arranged in any way you like. You can also create multiple dashboards for different purposes, such as monitoring server performance, application metrics, or business analytics.
Another key feature of Grafana is its support for plugins and extensions. There are hundreds of community-developed plugins available for Grafana, which provide additional functionality and integration with other tools and platforms. This means that you can extend the capabilities of Grafana to meet your specific needs, such as integrating it with your existing monitoring and alerting systems.
Grafana also offers advanced features for data exploration and analysis, such as ad-hoc filtering and drill-down capabilities. This allows you to quickly identify trends and anomalies in your data, and investigate them further using detailed visualizations and metrics.
In summary, Grafana is a powerful and flexible tool for monitoring and visualizing data from multiple sources. Its open-source nature and large community of contributors make it a popular choice for organizations and individuals who want to create customized dashboards and analytics solutions.
Get in touch with Grafana

edited by
Jack Richards is a self-proclaimed geek and AI enthusiast who has been freelancing as a writer for over a decade. With a rich writing experience in various niches, Jack's love for technology led him to explore the world of AI-powered tools and GPT-3 & GPT-4 apps. He has been fascinated with the possibilities that AI can bring to the writing world, and spends much of his time experimenting with different tools and software. Jack's passion for writing and technology has led him to create some of the most unique and thought-provoking content in his field, making him a recognized name among the writing community.


