 New
New
 Free
Free
 Home
Home


Graphy app is an innovative solution designed to empower businesses in effortlessly producing captivating and dynamic data visualizations. By harnessing the capabilities of artificial intelligence, this tool delivers a seamless chart-making experience, eliminating the necessity for complex technical expertise. With Graphy, users can create visually stunning charts and graphs that not only captivate their audience but also provide valuable insights. This free app serves as a valuable asset for businesses seeking to efficiently communicate complex data in an engaging manner.
Usage: Productivity
Pricing: Contact for Rates
Tags: businesses revolutionizes innovative solution visually captivating data visualizations free chart-maker tool
For more information, jump to:
Screenshots | Videos | Similar Tools | FAQs | Pros and Cons | Facts


Product Screenshots

Video Reviews
Similar Tools to Graphy App
-
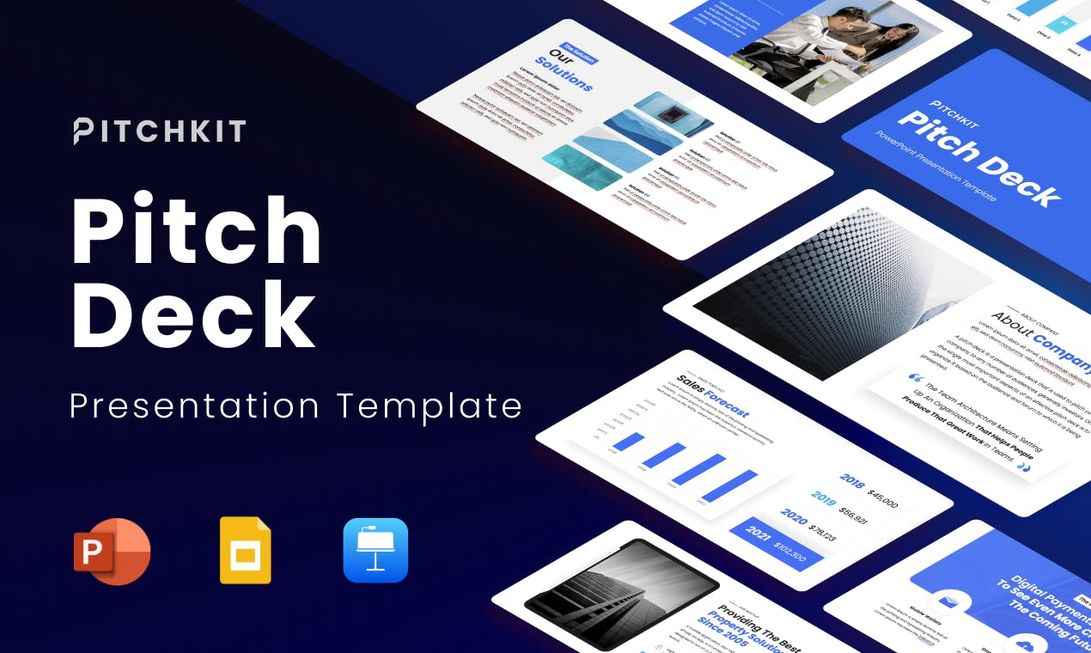
The perfect Pitch deck presentation design and other business tools help you plan your business. All the slides needed to sell your idea and more, are included in this awesome +50 slide template. It's fully editable so you can customize it easily
 Free
#Presentation
Free
#Presentation
-
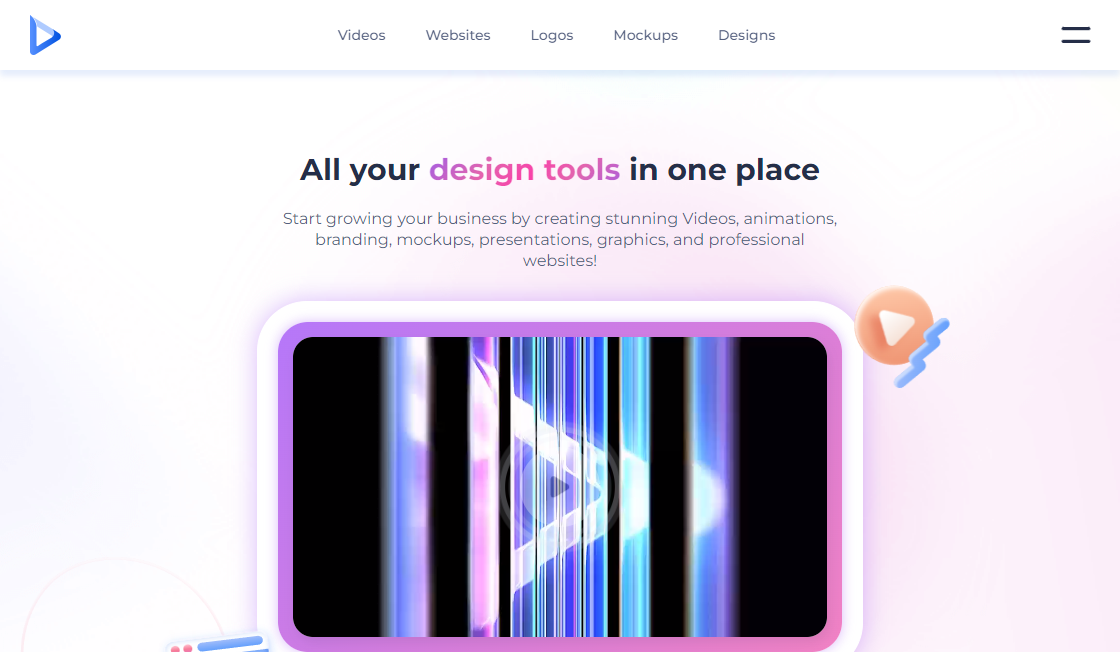
We introduce solutions that help you create presentation designs professionally yet easily. Our mission is shaping the future of how everyone presents his idea by building the all-in-one presentation design solution and empowering everyone to design outstanding presentations.
Free
#Presentation
-
Zen Mode for macOS - Avoid those awkward moments in public places or in presentation meetings in 1-click
Free
#Presentation
-
Renderforest is a powerful online tool that allows users to create professional animated explainer, promotional and marketing videos instantly. It offers a wide range of customizable templates, high-quality animations, and easy-to-use editing tools that enable users to create stunning videos in minutes. With Renderforest, businesses, marketers, and individuals can produce engaging content that will grab the attention of their target audience and boost their brand's visibility. Whether you need to create a product demo, a social media ad, or a corporate presentation, Renderforest has everything you need to make your video production process smooth, fast, and effective.
Free
#Presentation
-
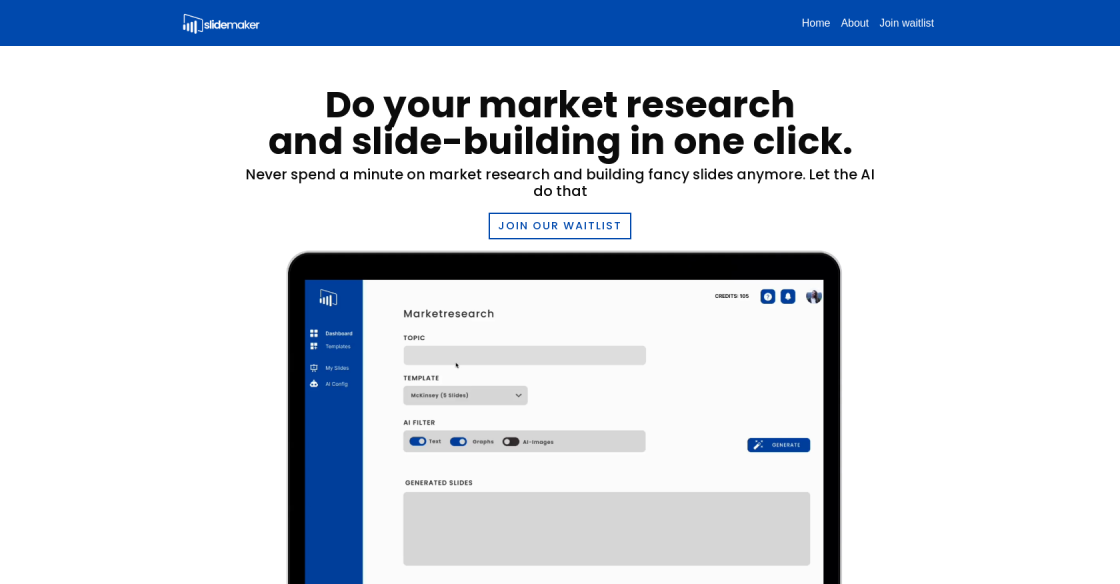
Slidemaker is an innovative tool that is transforming the way management consulting projects are approached. Powered by advanced artificial intelligence, it offers a comprehensive solution for market research and slide-building. With access to thousands of consulting slides and the latest databases of market data, Slidemaker has become an indispensable tool for management consultants. Its impressive knowledgebase, derived from the GPT model, enables the software to generate high-quality presentations with ease. Slidemaker's ability to streamline the slide-building process helps companies optimize their time and resources, resulting in more efficient and successful business strategies.
Free
#Presentation
-
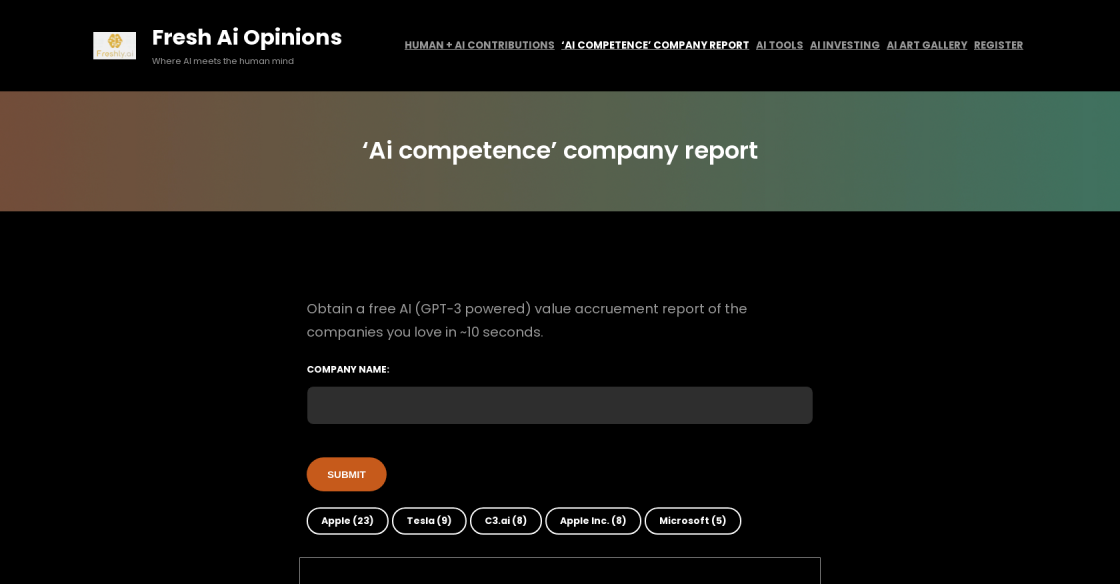
Freshly.ai, also known as Fresh Ai Opinions, is a recently launched website in February that has been gaining attention for its unique approach to gathering and analyzing opinions. The platform provides a platform for users to share their thoughts on various topics and uses artificial intelligence to analyze the data and provide insights. With its innovative technology and user-friendly interface, Freshly.ai is quickly becoming a go-to destination for those looking to stay up-to-date on the latest trends and opinions.
Free
#Presentation


Top Rated Tools
-
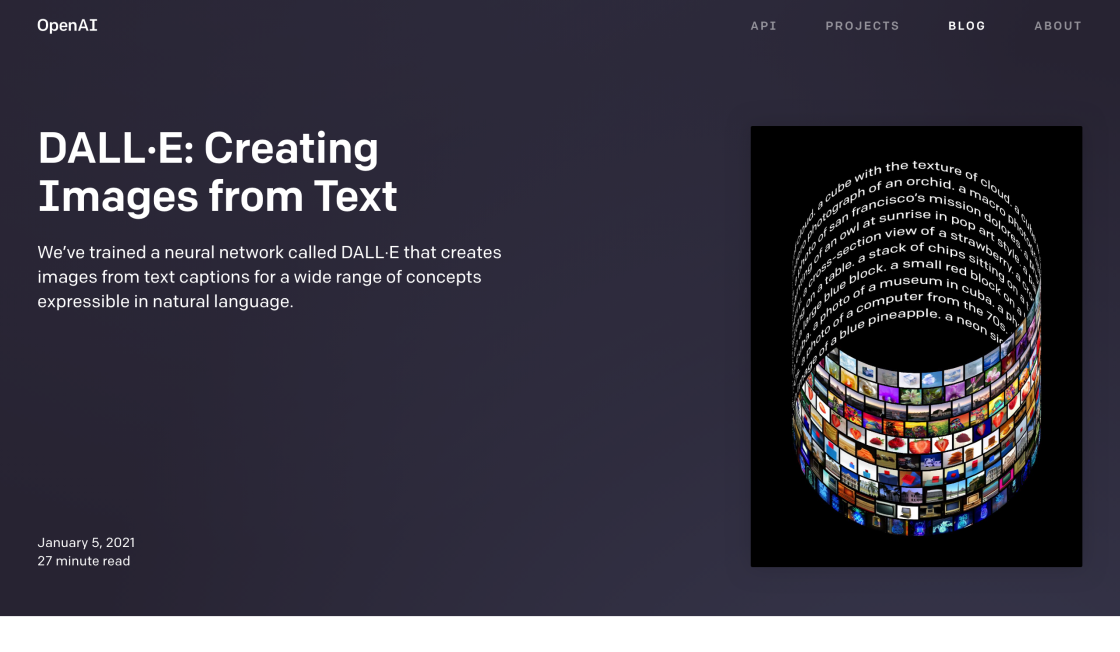
DALL·E By OpenAI
GPT-3 Model for Image Generation
Contact for Rates #Image Editing -
Zapier
OpenAI (Makers of ChatGPT) Integrations | Connect Your Apps with Zapier
Contact for Rates #Automation -
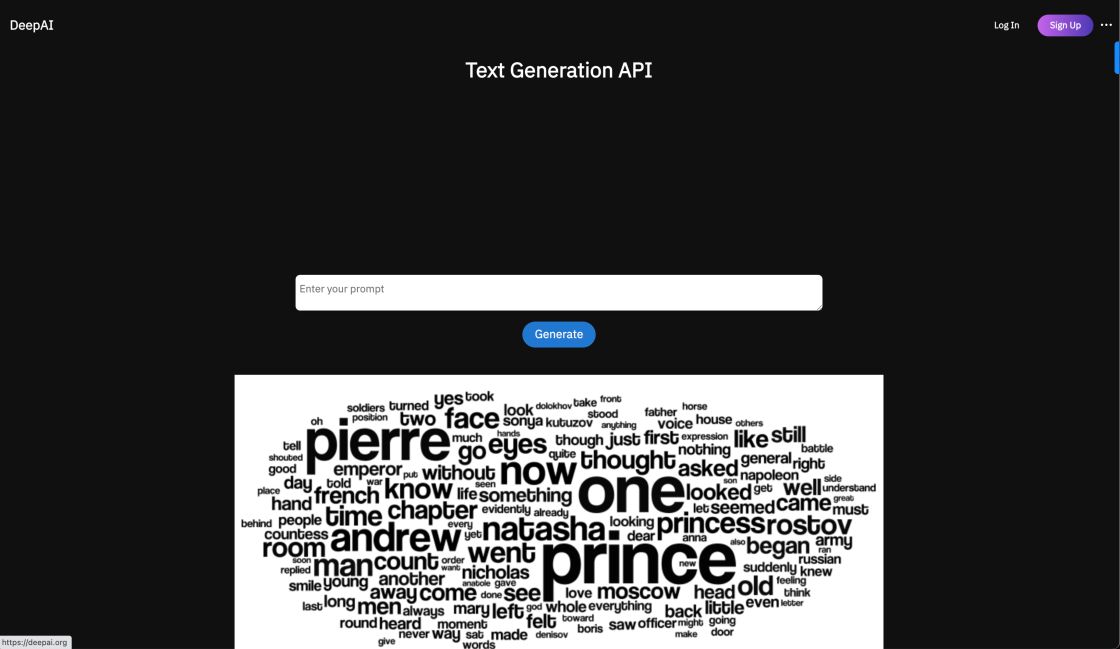
DeepAI Text Generator
Text Generation API | DeepAI
Contact for Rates #Text Editing -
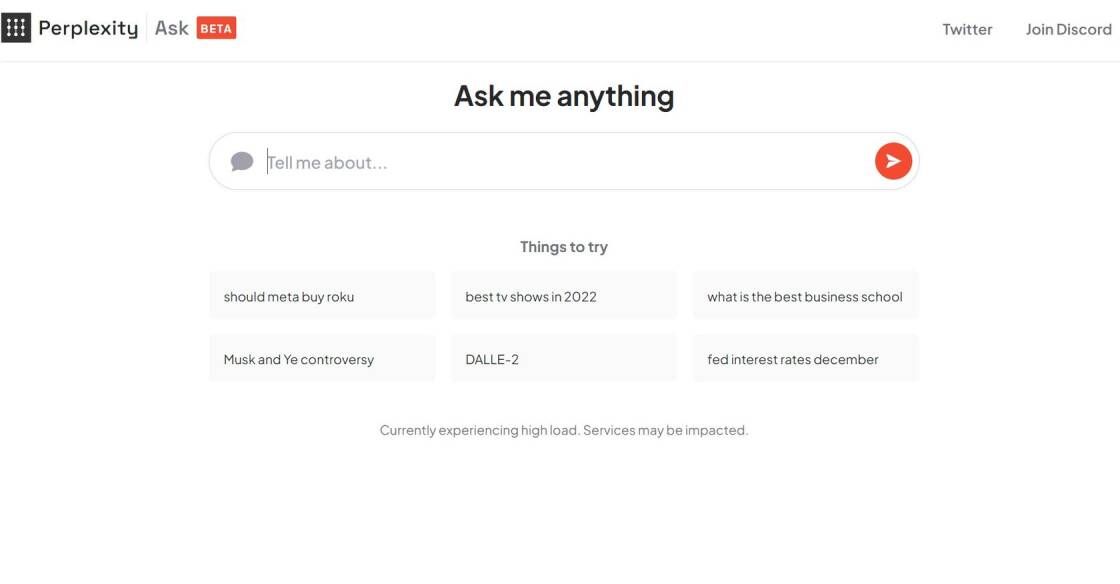
Perplexity AI
Building Smarter AI
Free #Chatgpt Alternative -
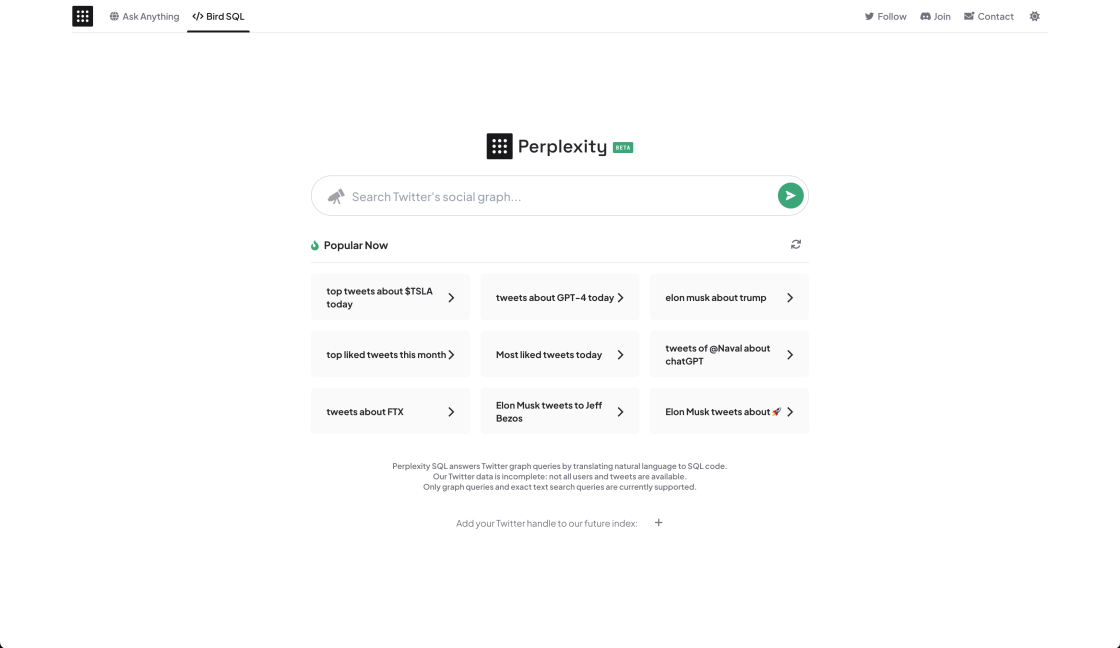
Perplexity AI: Bird SQL
A Twitter search interface that is powered by Perplexity’s structured search engine
Contact for Rates #Search Engine -
Deepfake AI Negotiation With DoNotPay
Negotiate with scammers and spammers on your behalf
Contact for Rates #Deepfake -
TwitterBio
AI Twitter Bio Generator – Vercel
-
Voicemaker
Voicemaker® - Text to Speech Converter
Paid #Text Editing


The Graphy app revolutionizes the way businesses create and present data visualizations. As a free chart-maker tool, Graphy empowers organizations to effortlessly produce sleek and interactive charts, without the requirement of extensive technical expertise. Through the integration of artificial intelligence, this innovative tool enables users to generate visually stunning charts that effectively communicate their data-driven insights.
With Graphy, businesses can bid farewell to complicated and time-consuming chart creation processes. The app’s user-friendly interface and intuitive design allow users of all skill levels to effortlessly navigate its features and functionalities. Gone are the days when designing eye-catching charts was limited to those with advanced technical know-how. Now, anyone can unlock their creative potential and transform raw data into visually compelling representations.
Thanks to its use of artificial intelligence, Graphy boasts a range of advanced features that simplify and streamline the chart-making process. Through intelligent algorithms, the app automatically analyzes the provided data and suggests the most suitable chart types to visualize the information effectively. This eliminates the guesswork involved in selecting the appropriate chart format and saves valuable time for users.
In addition, Graphy offers a diverse collection of customizable templates, allowing businesses to effortlessly align their charts with their brand identity. Users can easily modify colors, fonts, and layouts to create charts that seamlessly integrate with their existing visual assets. With Graphy, presenting complex data in an engaging and professional manner has never been easier.
In conclusion, the Graphy app is an indispensable tool for businesses seeking to effectively communicate their data through visually appealing charts. By leveraging the power of artificial intelligence, Graphy empowers users of all skill levels to effortlessly produce stunning and interactive data visualizations. With this tool at their disposal, businesses can unlock the full potential of their data and captivate audiences with their insights.

Top FAQ on Graphy App
1. What is Graphy app?
Graphy app is a free chart-maker tool that businesses can use to create visually appealing and interactive data visualizations.
2. How does Graphy app work?
Graphy app utilizes artificial intelligence to enable users to generate stunning charts effortlessly, without requiring advanced technical skills.
3. Can I use Graphy app for free?
Yes, Graphy app is available for free, allowing businesses to easily create slick and interactive data visualizations without any cost.
4. Do I need any technical skills to use Graphy app?
No, Graphy app is designed to be user-friendly and does not require any advanced technical skills. It is accessible for users of all levels of expertise.
5. What types of charts can Graphy app create?
Graphy app can create a wide range of charts, including bar graphs, pie charts, line graphs, scatter plots, and more. Users have a variety of options to choose from.
6. Can I customize the appearance of the charts created with Graphy app?
Yes, Graphy app provides customization options, allowing users to tailor the appearance of their charts according to their preferences or brand guidelines.
7. Is Graphy app suitable for businesses of all sizes?
Yes, Graphy app is suitable for businesses of all sizes. Whether you are a small startup or a large corporation, you can benefit from the chart-making capabilities of this app.
8. How can Graphy app benefit my business?
Graphy app can benefit your business by helping you present complex data in a visually appealing and easily understandable format. This can aid in decision-making, data analysis, and effective communication with stakeholders.
9. Is there a limit to the number of charts I can create using Graphy app?
No, there is no limit to the number of charts you can create using Graphy app. You can create as many charts as your business needs, without any restrictions.
10. Can I share the charts created with Graphy app?
Yes, Graphy app allows users to easily share the charts they create. You can export the charts as image files or directly share them via email or social media platforms.
11. Are there any alternatives to Graphy App?
| Competitor | Description | Key Differences |
|---|---|---|
| Tableau | Tableau is a powerful data visualization platform | - Offers a wide range of advanced features and capabilities for data analysis and visualization - Requires some technical knowledge to use effectively - Suitable for complex data visualizations and detailed analytics |
| Power BI | Power BI is a business analytics tool | - Developed by Microsoft, integrates well with other Microsoft products - User-friendly interface with drag-and-drop functionality - Offers a robust set of features for data analysis and visualization - Good for real-time data monitoring and reporting |
| Google Data Studio | Google Data Studio is a free reporting tool | - Offers seamless integration with other Google products - Simple drag-and-drop interface - Limited advanced functionalities compared to paid tools - Best suited for basic data visualizations and reporting |
| QlikView | QlikView is a data discovery and analysis tool | - Provides powerful data visualization and exploration capabilities - Requires technical skills to build complex visuals - Suitable for large-scale data analysis and interactive dashboards |
| Domo | Domo is a cloud-based business intelligence tool | - Offers a wide range of data visualization and reporting options - Focuses on collaboration and sharing dashboards across teams - More suitable for enterprise-level businesses and complex data analysis |

Pros and Cons of Graphy App
Pros
- Enables businesses to create slick and interactive data visualizations
- Free to use, making it accessible for businesses of all sizes
- Does not require advanced technical skills due to its artificial intelligence capabilities
- Generates stunning charts, enhancing the visual impact of data
- Provides an efficient way to present complex data in a visually appealing manner
- Simplifies the chart-making process, saving time and effort for users.
Cons
- Limited customization options: Graphy app may offer pre-designed templates and styles, but users might find the options for customizing charts to be limited. This can result in a lack of flexibility in representing specific data or matching brand aesthetics.
- Dependency on artificial intelligence: While the use of AI can make chart creation easier, it also means that the functionality and capabilities of the tool rely heavily on the performance and accuracy of the AI algorithms. Any limitations or errors in the AI system can affect the quality or reliability of the generated charts.
- Difficulty with complex data sets: Graphy app might struggle to handle complex or large data sets. Users who need to visualize intricate data relationships or multiple variables might find the app's capabilities to be insufficient, resulting in less accurate or incomplete chart representations.
- Lack of advanced features: The simplicity of Graphy app may be a disadvantage for more advanced users who require sophisticated features such as statistical analysis, 3D chart rendering, or dynamic data integration. The app's focus on ease-of-use means it might not meet the needs of users seeking more advanced charting capabilities.
- Internet connectivity requirement: As Graphy app is an online tool, it relies on an internet connection to function. This can pose limitations for users who work in areas with poor or no internet access, making it difficult to access or create charts when needed.

Things You Didn't Know About Graphy App
Graphy app is a remarkable chart-maker tool that offers businesses an effortless way to create captivating and user-friendly data visualizations. With the integration of artificial intelligence, this innovative tool empowers users to effortlessly generate visually striking charts, eliminating the requirement for complex technical expertise. By leveraging Graphy app's functionalities, businesses can effectively communicate their data insights in a polished and interactive manner, enhancing the overall visual appeal and engagement of their presentations. This tool proves to be a valuable asset for organizations seeking to convey information effectively and efficiently.

edited by
Mark Roberts is a seasoned writer with over 15 years of experience in the world of freelance writing. Mark has worked with various clients across different industries and is well-versed in crafting engaging content that resonates with his audience. As a tech enthusiast, Mark has a keen interest in AI-powered tools and GPT-3 & GPT-4 apps, and is always on the lookout for new ways to integrate these tools into his work. Mark is a self-confessed geek and loves nothing more than getting lost in a good book or tinkering with new software. When he's not writing, Mark can be found honing his skills as a developer and working on his latest side project.


