 New
New
 Free
Free
 Home
Home

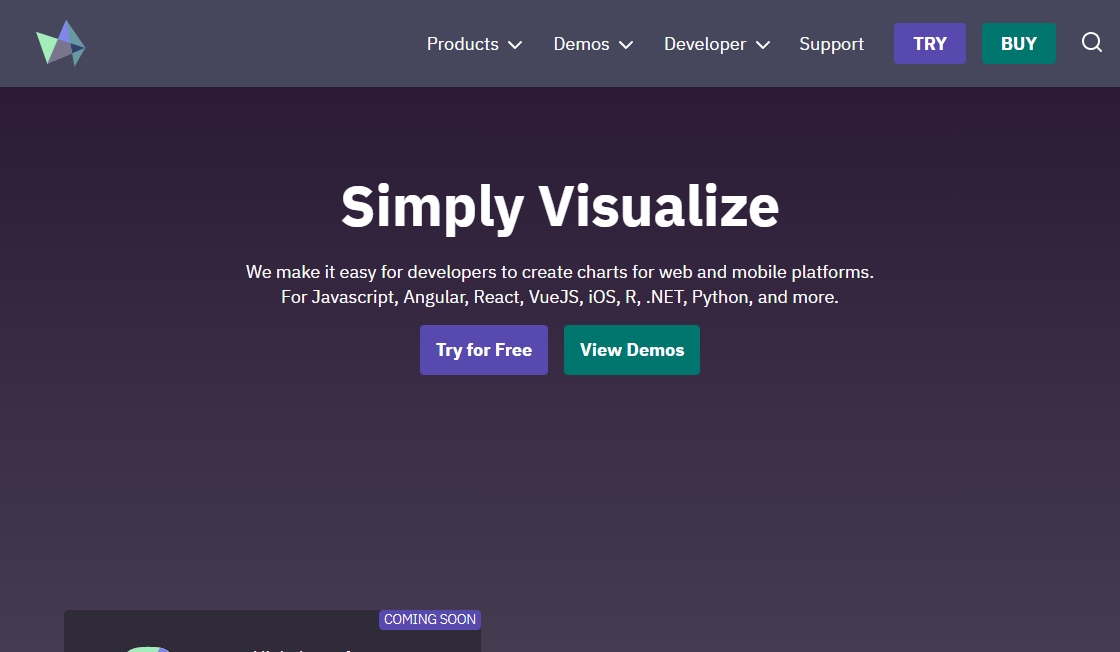
HighCharts is a JavaScript library that enables users to create engaging and interactive charts for web applications. With its extensive range of features, HighCharts offers an intuitive interface that allows developers to build charts that are both visually appealing and user-friendly. Whether you need to create simple line charts or complex heat maps, HighCharts provides a powerful toolset that can help you bring your data to life. This article will explore the key features of HighCharts and how it can be used to enhance the user experience of your web applications.
Usage: Data
Pricing: Contact for Rates - Free/Paid plans
Tags: intuitive interface visually appealing web applications data visualization JavaScript library
For more information, jump to:
Screenshots | Videos | Similar Tools | FAQs | Pros and Cons | Facts


Product Screenshots
Video Reviews
Similar Tools to HighCharts
-
B2Metric IQ Analytics is a groundbreaking platform that utilizes cutting-edge technology to offer exceptional personalization and marketing intelligence services. This platform leverages advanced analytics and AI-powered insights to help businesses improve their overall performance. With its self-service behavior insight tool, B2Metric provides real-time data analysis of complex customer digital journeys, which can help enhance customer retention rates. With such innovative features, B2Metric IQ Analytics is fast becoming the go-to solution for businesses looking to stay ahead of the competition.
 Contact for Rates
#Database
Contact for Rates
#Database
-
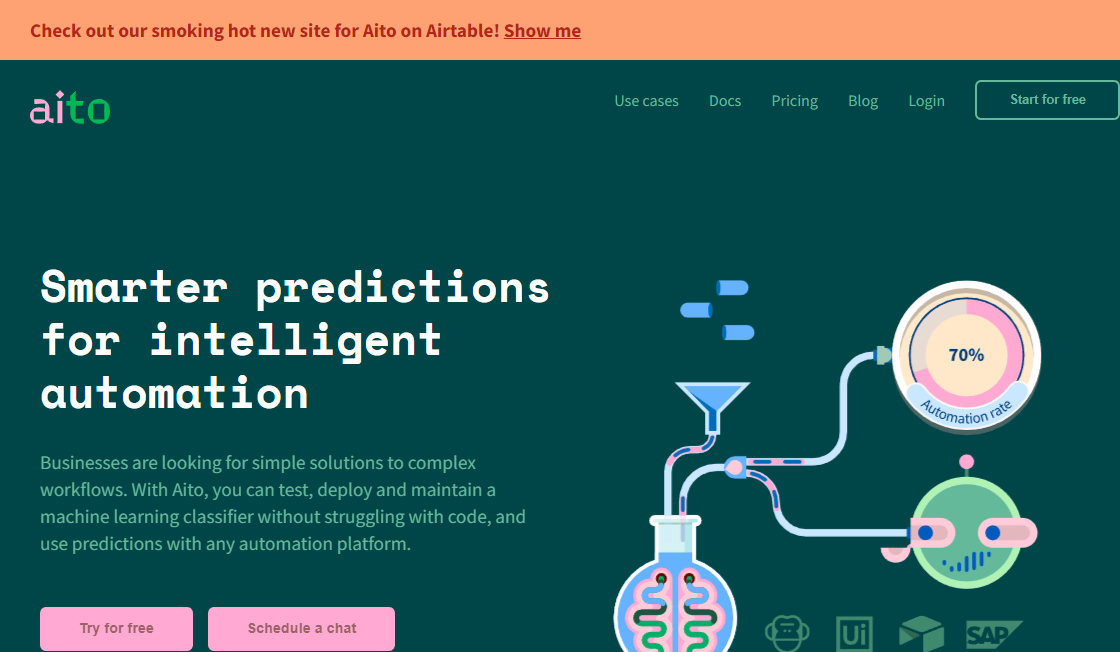
Aito is a revolutionary AI-driven database that offers a fully managed GraphQL API for developers to build smarter applications rapidly. With Aito, developers can leverage the power of artificial intelligence to enhance the speed and efficiency of their application development process. The platform offers a seamless integration of machine learning algorithms with GraphQL, providing developers with a comprehensive solution for building intelligent and responsive applications. Aito's advanced technology offers an innovative alternative to traditional databases, making it a valuable asset for organizations looking to streamline their development processes and stay ahead of the competition.
Paid
#Database
-
Datawatch Monarch is a powerful platform designed to help businesses gather, transform, and visualize data for analysis. With its advanced data preparation and analytics capabilities, organizations can streamline their workflow and make data-driven decisions with greater ease and accuracy. Whether you're dealing with large datasets or complex data structures, Datawatch Monarch provides the tools you need to extract valuable insights and improve your bottom line. So if you're looking for a comprehensive data management solution that can help you stay ahead of the curve, look no further than Datawatch Monarch.
Contact for Rates
#Database
-
RapidMiner Studio is a cutting-edge AI platform designed specifically for data science teams. This platform is equipped with advanced capabilities and analytical tools that enable professionals to analyze large datasets and extract valuable insights. RapidMiner Studio is favored by many data scientists due to its flexibility, user-friendliness, and ability to integrate with other tools. It is a reliable solution for businesses looking to make data-driven decisions and gain a competitive edge in the market.
Contact for Rates
#Database
-
KNIME is a robust open-source data analytics, reporting, and integration platform designed to meet the needs of data scientists, analysts, and developers. It provides an efficient and straightforward way to analyze data using various techniques, including machine learning, data mining, and statistical analysis. KNIME's comprehensive suite of tools enables users to visualize, manipulate, and transform data from a wide range of sources, making it an ideal solution for organizations looking to streamline their data analytics processes. This article will explore the features and benefits of KNIME and how it can help organizations make data-driven decisions.
Freemium
#Database
-
EZQL - Outerbase is a revolutionary database interface that offers users with an easy and intuitive way to explore and collaborate on data without any need for SQL coding. With its user-friendly interface, EZQL - Outerbase enables users to access powerful features such as in-line editing, blocks of SQL queries, and the ability to share queries with team members. This comprehensive database interface is designed to simplify the process of working with complex data, making it an ideal solution for businesses and organizations looking to streamline their operations.
Paid
#Database

Top Rated Tools
-
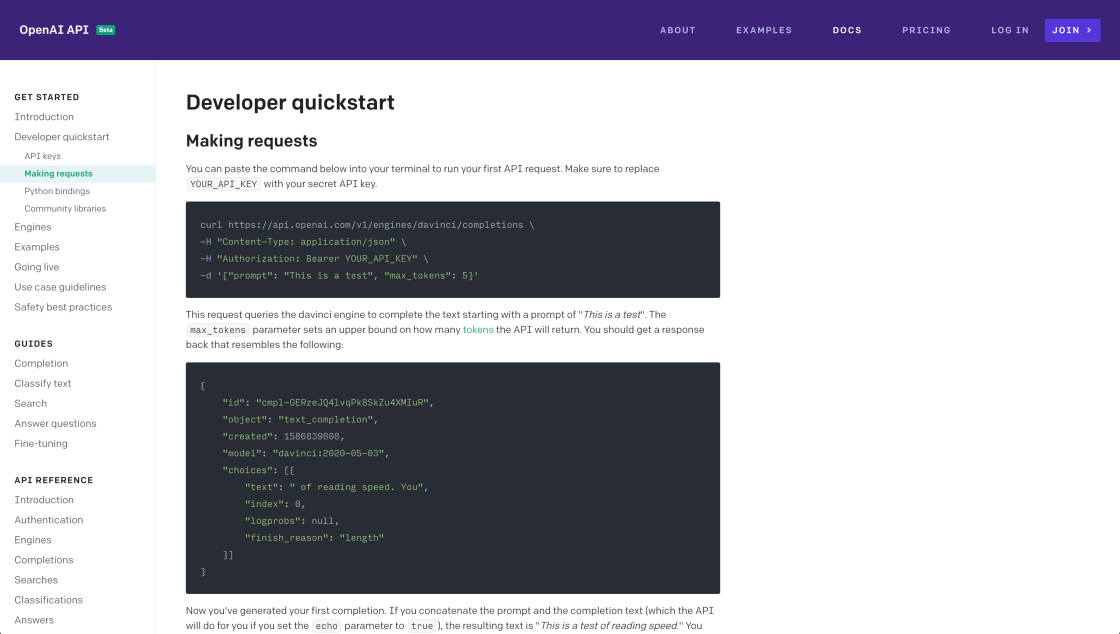
GPT-3 API
An API for accessing new AI models developed by OpenAI.
Contact for Rates #Website Development -
Ghostwriter
Ghostwriter - Code faster with AI - Replit
Paid #Creative Writing -
AI Time Machine
AI Time Machine™ : créez des avatars IA et voyagez dans le temps
Freemium #Avatar Generation -
LanguageTool
LanguageTool - Online Grammar, Style & Spell Checker
Freemium #Paraphrasing -
Wordtune
Wordtune | Your personal writing assistant & editor
Paid #Paraphrasing -
Writesonic
Writesonic - Best AI Writer, Copywriting & Paraphrasing Tool
Paid #Others -
Socratic By Google
Get unstuck. Learn better. | Socratic
Free #Chatgpt Alternative -
Chai
AI Writing Assistant
Free #Conversation

HighCharts is a popular JavaScript library that enables developers to create interactive and dynamic charts for web applications. This library offers an array of features such as animations, zooming, exporting, and scrolling, which make it easier to represent complex data sets in a visually appealing manner. With its simple yet powerful API, HighCharts allows developers to customize the charts according to their preferences and requirements. Whether you want to display financial data, sales trends, or geographical information, HighCharts provides a wide range of chart types, including line, column, bar, pie, scatter, and more. Moreover, this library is cross-browser compatible and responsive, which means that your charts will look great on any device or platform. Whether you're a beginner or an experienced developer, HighCharts can help you create stunning charts that enhance the user experience and provide valuable insights. In this article, we'll explore some of the key features of HighCharts and show you how to get started with this powerful tool.

Top FAQ on HighCharts
1. What is HighCharts?
HighCharts is a JavaScript library that allows you to create interactive and animated charts for web applications.
2. What types of charts can be created with HighCharts?
HighCharts supports a wide range of chart types, including line charts, bar charts, pie charts, scatter plots, and more.
3. Is HighCharts open source?
No, HighCharts is not open source. It is available under a commercial license.
4. Does HighCharts support mobile devices?
Yes, HighCharts is compatible with mobile devices and can be used to create responsive charts that work on any device.
5. Can HighCharts be integrated with other JavaScript frameworks?
Yes, HighCharts can be easily integrated with other JavaScript frameworks such as Angular, React, and Vue.
6. Does HighCharts support real-time data?
Yes, HighCharts has built-in support for real-time data updates, making it ideal for creating live data visualizations.
7. What programming languages are supported by HighCharts?
HighCharts is primarily designed to work with JavaScript, but it can also be used with other programming languages such as PHP and Python.
8. Is HighCharts easy to use for beginners?
Yes, HighCharts is easy to use for beginners, thanks to its intuitive API and extensive documentation.
9. What kind of support is available for HighCharts users?
HighCharts offers comprehensive documentation, tutorials, and community support forums to help users get started and troubleshoot any issues they encounter.
10. Can HighCharts be customized to match a website's design?
Yes, HighCharts can be fully customized to match the design of your website, including colors, fonts, and styles.
11. Are there any alternatives to HighCharts?
| Competitors | Description | Main Features | Price |
|---|---|---|---|
| D3.js | A JavaScript library for manipulating documents based on data. | Provides powerful visualization components and modules for creating custom visualizations. | Free |
| Plotly | An online graphing, analytics, and statistics platform. | Provides a cloud-based platform for creating, sharing, and collaborating on interactive charts and dashboards. | Free (basic), $29/month (professional), $79/month (team) |
| FusionCharts | A JavaScript charting library that offers over 100+ charts and 2,000+ maps. | Provides a wide range of chart types, including real-time charts, gauges, and heatmaps. | Starts at $499/year |
| Google Charts | A free charting library that offers a wide range of chart types and customization options. | Provides easy integration with Google Sheets and other Google services. | Free |
| Chart.js | A simple yet flexible JavaScript charting library for designers and developers. | Has a lightweight footprint and offers several chart types and customization options. | Free |

Pros and Cons of HighCharts
Pros
- HighCharts is a powerful and versatile JavaScript library that allows developers to create interactive charts for web applications with ease.
- The library offers a wide range of chart types and customization options, allowing developers to create unique and visually appealing charts.
- HighCharts is highly responsive and can handle large datasets with ease, making it suitable for use in a variety of applications.
- The library offers a range of animation and interactivity options, allowing users to interact with the charts and explore the data in a more engaging way.
- HighCharts is compatible with a range of browsers and devices, ensuring that your charts will work seamlessly across all platforms.
- The library is well-documented and supported by an active community of developers, making it easy to get help and find resources when needed.
- HighCharts is regularly updated with new features and improvements, ensuring that it remains a leading choice for chart creation in the web development community.
Cons
- HighCharts is not free for commercial use and requires a license.
- The library can be resource-intensive, leading to slower load times and performance issues on older devices or slower internet connections.
- Some users may find the customization options limited or difficult to use.
- HighCharts does not support all types of charts or data visualizations, which may require users to find additional libraries or tools.
- The documentation and support for HighCharts may not be as comprehensive or user-friendly as some other charting libraries.
- Depending on the complexity of the chart and the amount of data being visualized, HighCharts may require additional coding or configuration to achieve the desired result.

Things You Didn't Know About HighCharts
HighCharts is a popular JavaScript library that allows developers to create interactive and animated charts for web applications. It is a powerful tool that can be used to visualize complex data in a simple and easy-to-understand format.
Here are some things you should know about HighCharts:
1. Easy to use: HighCharts is very easy to use, even for developers who have no experience with charting libraries. It comes with a comprehensive documentation and many examples to help you get started.
2. Customizable: HighCharts is highly customizable, allowing you to change almost every aspect of the chart, including colors, fonts, and labels. You can also add your own custom features and functionality.
3. Interactive: One of the key features of HighCharts is its interactivity. Users can hover over data points to see more information, zoom in and out of the chart, and even download the chart as an image.
4. Cross-browser compatible: HighCharts works across all major web browsers, including Chrome, Firefox, Safari, and Internet Explorer. This means that you can create charts that work seamlessly on all devices.
5. Responsive design: HighCharts has a responsive design, which means that the charts will automatically adjust to fit the size of the screen. This makes it ideal for creating charts for mobile devices.
6. Large community: HighCharts has a large and active community of developers who are constantly contributing new features and improvements. This means that you can always find help and support when you need it.
In conclusion, HighCharts is a powerful and versatile JavaScript library that can help you create beautiful and interactive charts for your web applications. Whether you are a seasoned developer or just getting started, HighCharts is definitely worth checking out.

edited by
Samantha Lee is a freelance writer with over a decade of experience writing for a variety of industries. She is an avid enthusiast of AI powered tools and GPT-3 & GPT-4 apps, constantly exploring new ways to incorporate these technologies into her work. As a self-proclaimed geek, Samantha spends her free time diving deep into the latest tech gadgets and coding projects. Her writing has been featured in numerous publications and she has won several writing awards. When she's not writing or coding, you can find Samantha hiking or exploring new restaurants in her hometown of San Francisco.


