 New
New
 Free
Free
 Home
Home

Infogram is a popular online software that enables users to create interactive charts, maps, and other graphics with ease. It is an intuitive platform that offers a variety of templates, design elements, and data visualization tools to help users present their ideas more effectively. With Infogram, creating stunning visuals is a breeze, regardless of one's level of technical expertise. It is a cost-effective solution for businesses, educators, and individuals who want to communicate complex information in an engaging way. In this article, we will explore the features and benefits of Infogram and how it can enhance your data presentation skills.
Usage: Art & Design
Pricing: Freemium - Free and premium plans
For more information, jump to:
Screenshots | Videos | Similar Tools | FAQs | Pros and Cons | Facts


Product Screenshots
Video Reviews
Similar Tools to Infogram
-
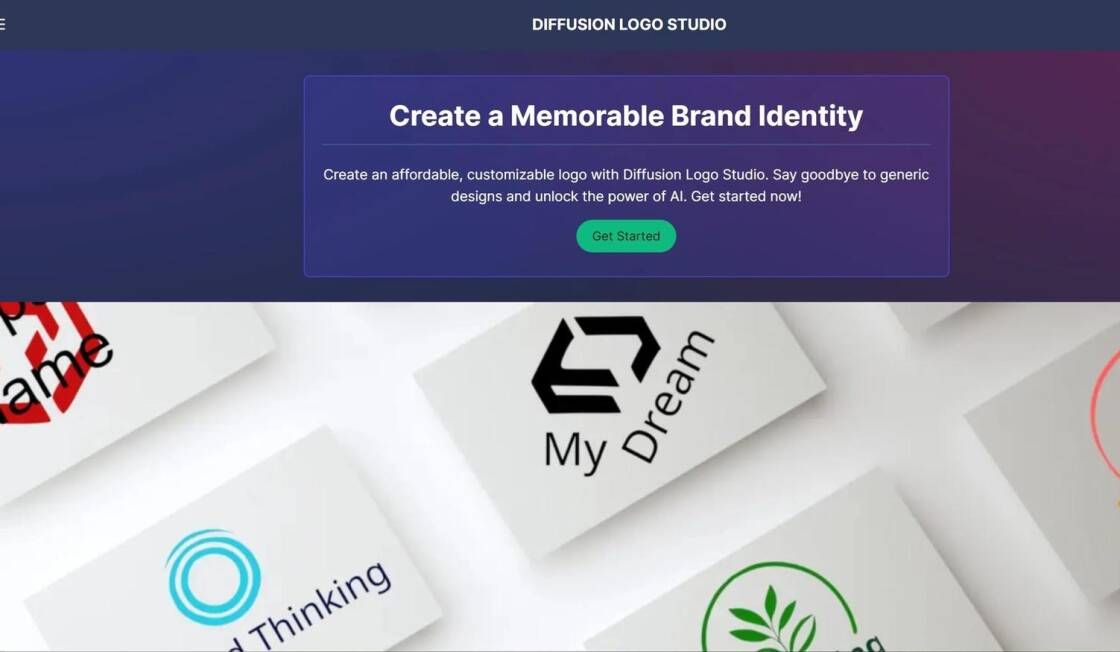
Revolutionize your logo design experience with Diffusion Logo Studio. With its innovative approach and cutting-edge tools, Diffusion Logo Studio is set to transform the way you create logos. Our studio offers a range of dynamic and customizable options that enable you to bring your brand vision to life like never before. Whether you're a small business owner, a creative professional, or an entrepreneur looking to make a statement, Diffusion Logo Studio provides the perfect platform for designing logos that captivate and connect with your target audience. Elevate your brand identity and stand out from the competition with Diffusion Logo Studio's unparalleled features and seamless interface.
 Paid
#Logo Generation
Paid
#Logo Generation
-
Logaster is a popular online logo maker that provides high-quality and customizable logo designs for individuals and businesses. This platform offers the flexibility of designing a logo with no prior design experience required. Logaster's user-friendly interface and extensive template library enable users to create their own unique logo quickly and efficiently. The logos created by Logaster are not only professional-looking but also affordable, making it an ideal solution for small businesses and startups looking to establish their brand identity.
Freemium
#Logo Generation
-
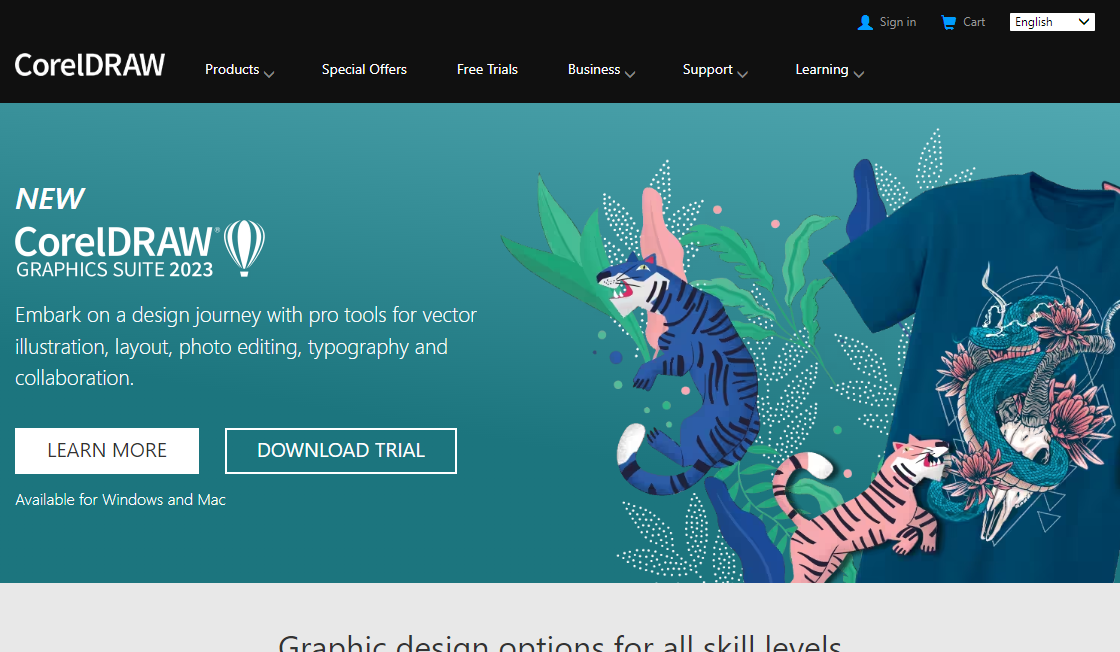
Corel Draw is one of the most popular vector graphics editors used by designers and digital artists. The software provides a comprehensive suite of tools for creating and editing vector graphics that can be used in a variety of applications such as print, web, and multimedia design. Corel Draw offers an intuitive interface, powerful tools, and a range of features that make it an ideal choice for both beginners and professionals. With its ability to scale images without losing quality, Corel Draw is a valuable tool for creating high-quality designs that can be used in a variety of settings.
Paid
#Logo Generation
-
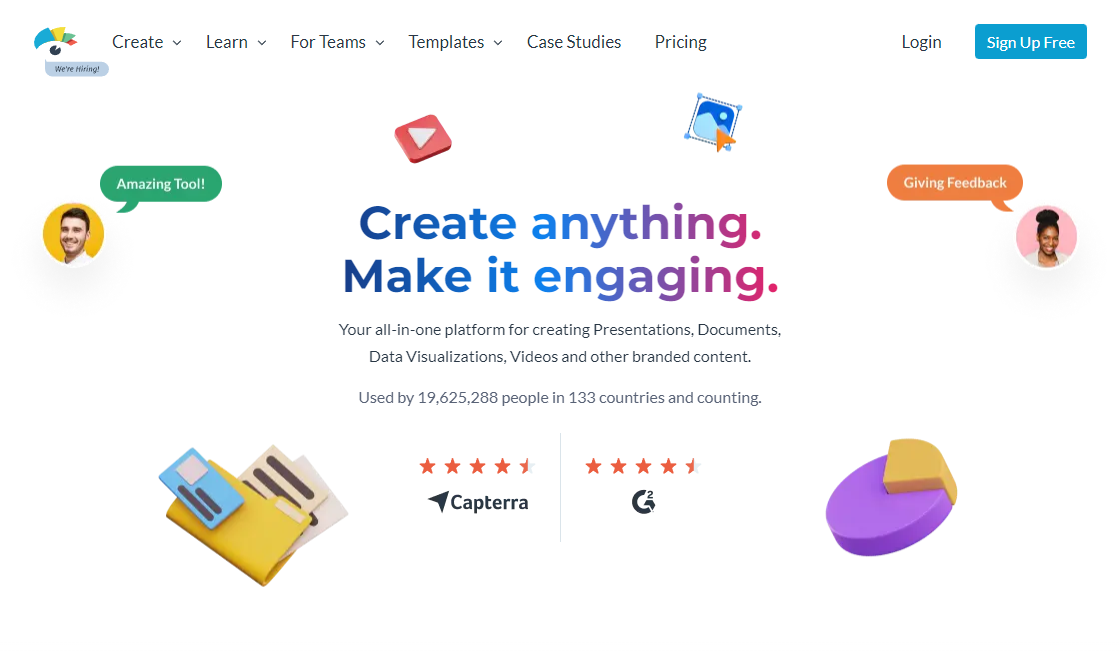
Visme is an innovative cloud-based graphic design tool that offers a simple and intuitive interface for creating stunning visuals. It enables users to produce professional-looking graphics, presentations, infographics, and more without requiring any prior design experience. This powerful software solution is perfect for businesses, educators, and individuals who want to enhance their visual communication and engage their audience in a meaningful way. With Visme, anyone can create beautiful, high-quality designs that are sure to impress.
Freemium
#Logo Generation
-
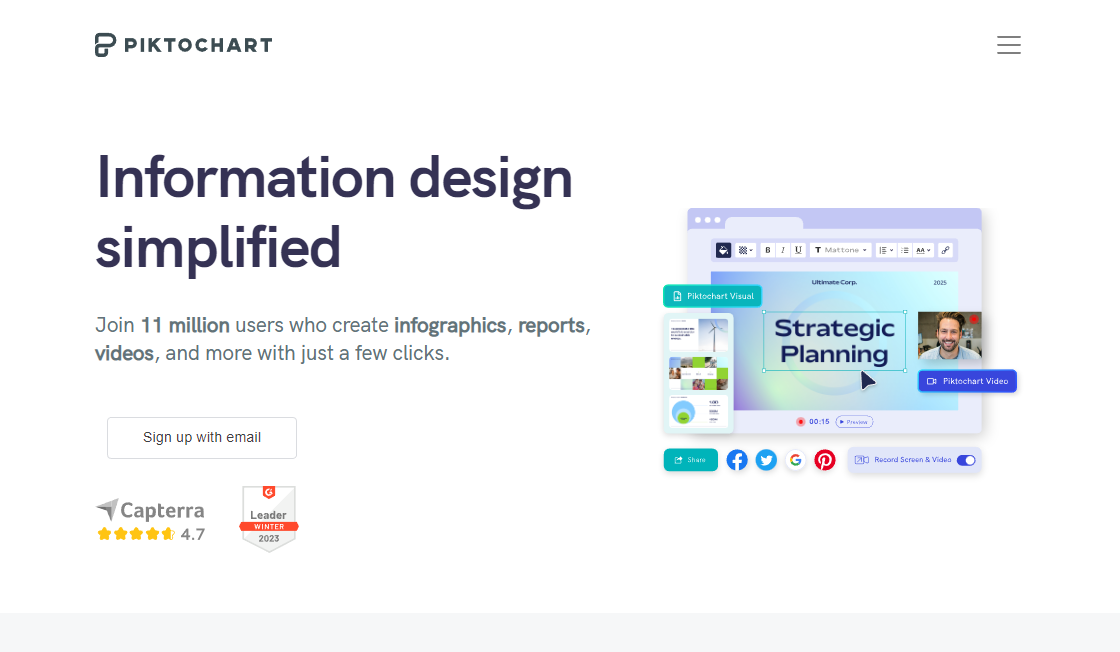
Piktochart is a user-friendly infographic maker that simplifies data visualization, creating visually stunning charts, graphs, maps, and other graphics. With its intuitive drag-and-drop interface and customizable templates, Piktochart makes it easy for users to create engaging and informative infographics without any design experience. The tool offers various functions to help users to visualize their data and communicate their message effectively. Piktochart is an ideal solution for businesses, educators, and individuals seeking to produce high-quality visual content for presentations, reports, or social media.
Freemium
#Logo Generation
-
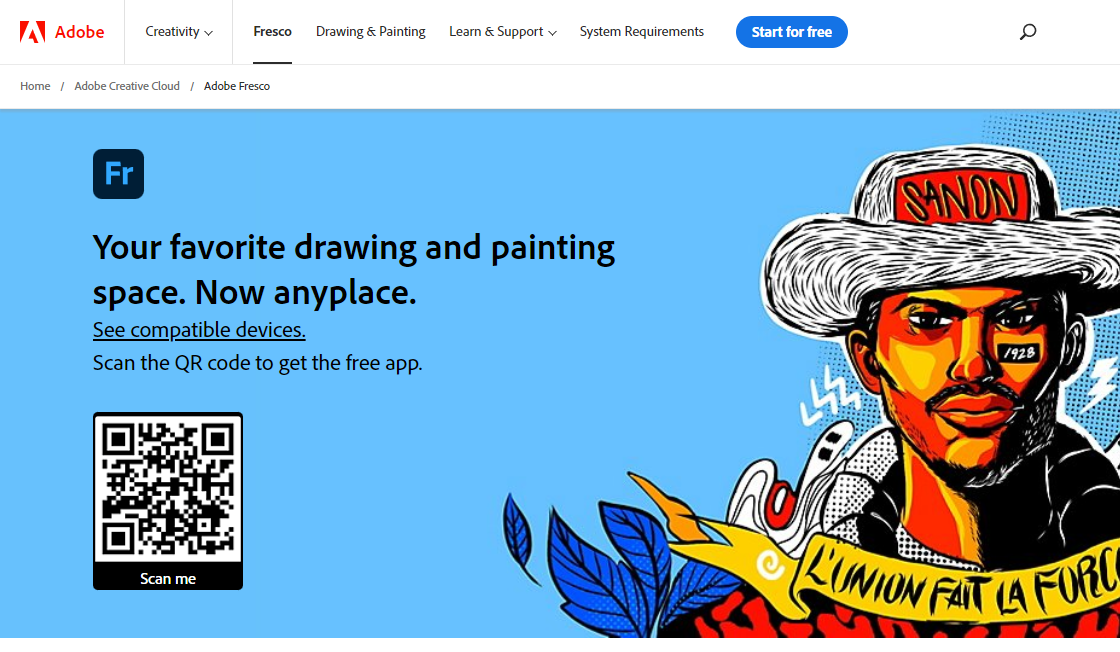
Adobe Fresco is a powerful graphic design tool that provides digital artists with the ability to create stunning vector and raster illustrations, comics, and other artwork. It offers an intuitive interface and advanced features that allow users to unleash their creativity and craft professional-grade designs. With its wide range of brushes and powerful painting and drawing tools, Adobe Fresco is a must-have tool for any digital artist looking to take their artwork to the next level. This innovative software empowers artists to push their boundaries and create unique, eye-catching designs that capture their imagination.
Contact for Rates
#Logo Generation
Top Rated Tools
-
Canva Text-to-Image
AI-Generated Graphics
Freemium #Image Editing -
Magic Write By Canva
The AI Powered Writing Tool
Contact for Rates #Writing Assistant -
500+ Openers For Tinder Written By GPT-3
500+ Original Conversation Starters
Contact for Rates #Humor -
Namecheap Logo Maker
AI Powered Logo Creation
Free #Logo Generation -
VidIQ
Boost Your Views And Subscribers On YouTube - vidIQ
Freemium #Others -
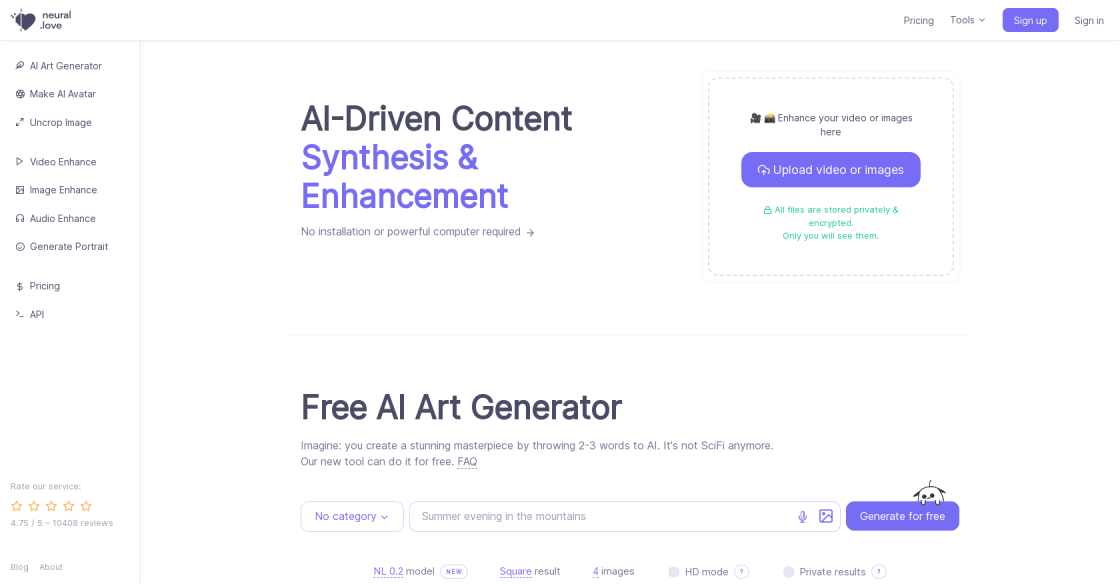
Neural.Love
Free AI Image Generator & AI Enhance | neural.love
Contact for Rates #Generative AI -
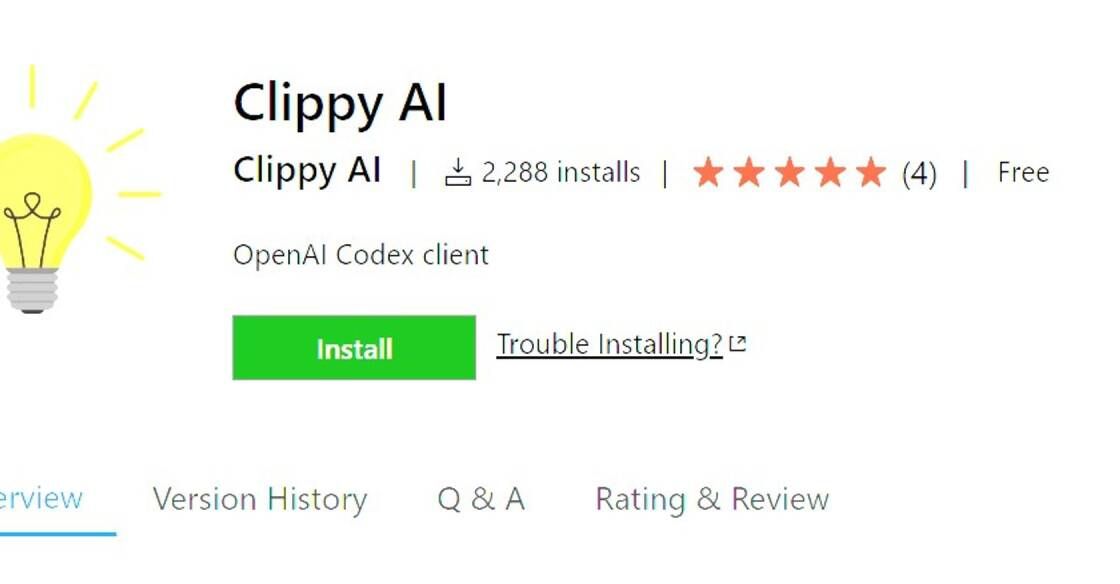
Clippy AI
AI-Powered Writing Assistant
Free #Code Assistant -
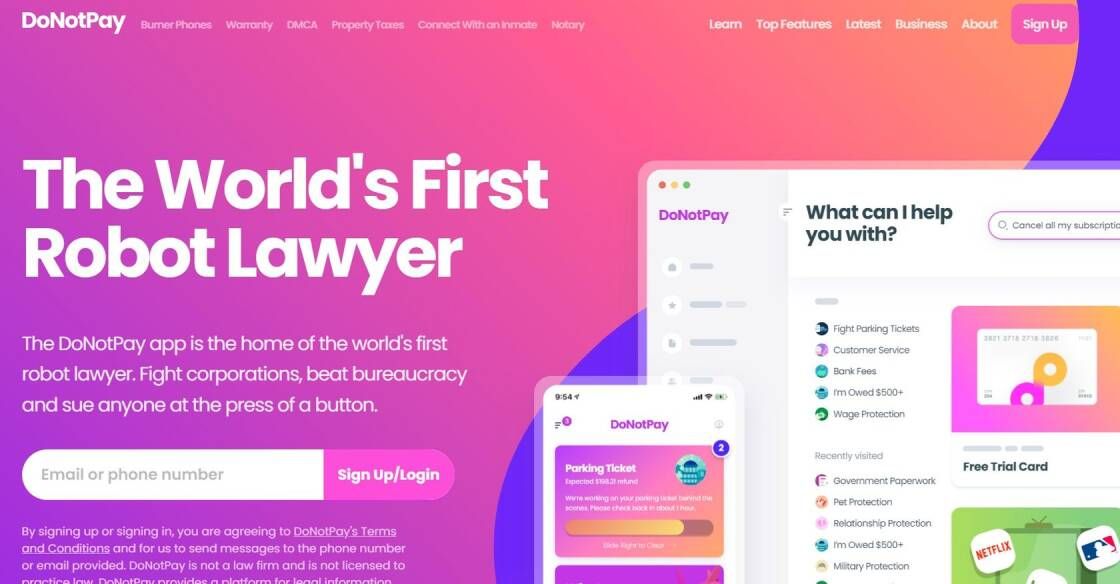
Donotpay
DoNotPay - The World's First Robot Lawyer
Paid #Deepfake

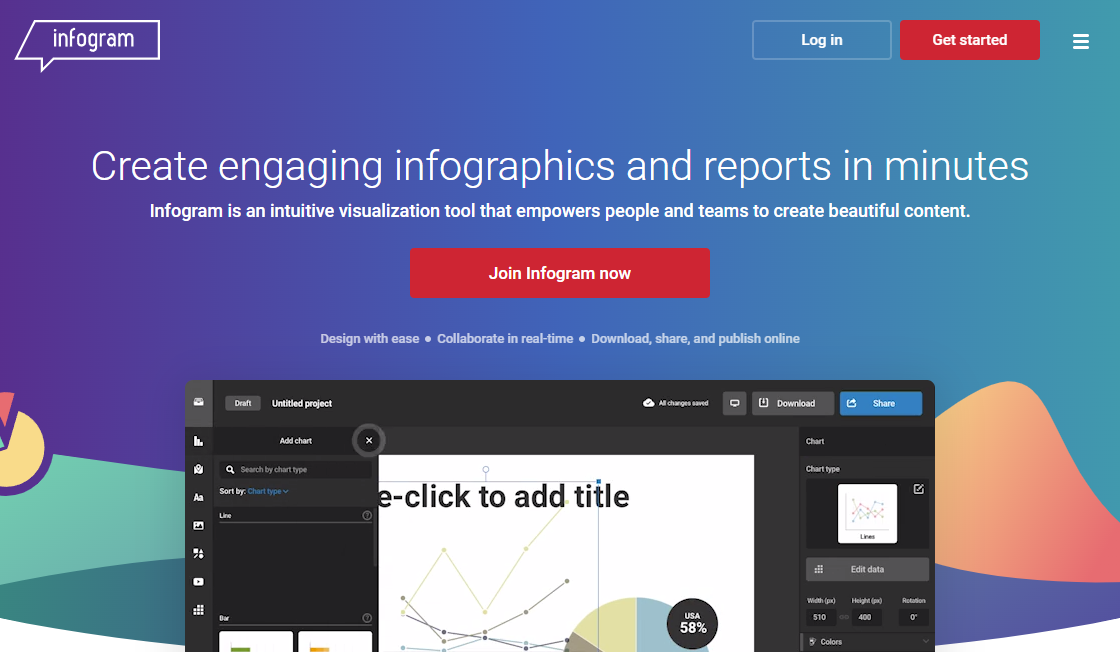
Infogram is an innovative online software that enables users to create interactive and visually appealing charts, maps, and graphics with ease. This user-friendly platform offers a range of features and tools that help individuals, businesses, and organizations to convey complex data in a compelling and engaging manner. Infogram's intuitive interface and drag-and-drop functionality allow users to create professional-looking visuals without any prior design experience. The software also provides a vast library of customizable templates and themes, making it easy for users to create graphics that match their brand image. Additionally, Infogram offers powerful data visualization tools that enable users to display their data in a meaningful way, including animated charts, interactive maps, and real-time data updates. With Infogram, users can create stunning visuals that make their data more accessible and understandable to their audience. Whether you need to create a report, presentation, or infographic, Infogram is the perfect tool to bring your data to life.

Top FAQ on Infogram
1. What kind of graphics can be created with Infogram?
Infogram allows users to create interactive charts, maps, and other graphics.
2. Is Infogram an online software?
Yes, Infogram is an online software that can be accessed from anywhere as long as there is an internet connection.
3. Can Infogram be used by non-designers?
Yes, Infogram is designed to be user-friendly and can be used by anyone regardless of their design skills.
4. Does Infogram have a free trial?
Yes, Infogram offers a free trial period for new users to test out the features of the software.
5. What are some of the benefits of using Infogram?
Infogram helps users create professional-looking graphics in minutes, saves time and effort, and is cost-effective.
6. Is it possible to share Infogram graphics on social media?
Yes, Infogram graphics can be shared easily on social media platforms like Facebook, Twitter, and LinkedIn.
7. Can Infogram graphics be embedded on a website?
Yes, Infogram graphics can be embedded on a website using an HTML code provided by the software.
8. Are there any limitations to the number of graphics that can be created with Infogram?
No, there are no limitations to the number of graphics that can be created with Infogram.
9. What types of data can be used in Infogram charts and maps?
Users can upload data in various formats including CSV, XLSX, and Google Sheets.
10. Does Infogram offer customer support?
Yes, Infogram provides customer support through email and live chat.
11. Are there any alternatives to Infogram?
| Competitor | Description | Key Features | Price |
|---|---|---|---|
| Tableau | Business intelligence and analytics software that allows users to create interactive data visualizations, dashboards, and reports. | Drag-and-drop interface, real-time collaboration, data blending, and natural language processing. | Free for public use, paid plans start at $12/user/month. |
| Power BI | Business analytics service by Microsoft that allows users to create interactive visualizations and reports. | Data exploration, real-time collaboration, AI-powered insights, and integration with other Microsoft products. | Free for public use, paid plans start at $9.99/user/month. |
| Canva | Graphic design platform that allows users to create social media posts, flyers, and infographics. | Easy-to-use interface, extensive library of templates and graphics, and collaboration features. | Free for basic use, paid plans start at $9.95/user/month. |
| Adobe Illustrator | Vector graphics editor that allows users to create logos, icons, and illustrations. | Precision drawing tools, extensive library of brushes and filters, and integration with other Adobe products. | Paid plans start at $20.99/month. |
| Google Charts | Web-based charting tool that allows users to create interactive charts and maps. | Customizable charts, integration with Google Sheets, and real-time collaboration. | Free to use. |

Pros and Cons of Infogram
Pros
- Easy to use interface with drag-and-drop functionality
- Wide range of templates and graphics available for use
- Ability to create interactive charts and maps that can be embedded on websites or shared via social media
- Real-time data integration and automatic updates for charts and maps
- Collaboration features allow multiple users to work on the same project simultaneously
- Option to download high-resolution graphics for use in presentations or print materials
- Affordable pricing plans for individuals, teams, and businesses.
Cons
- Limited customization options for graphics
- Limited data importing options
- Limited interactivity options for charts and maps
- High cost for premium features
- Steep learning curve for beginners
- Limited font options
- Limited support for advanced functions and formulas
- Limited collaboration features
- Limited export options for high-quality print or web-ready graphics
- No offline capabilities.

Things You Didn't Know About Infogram
Infogram is an online software that is designed to help users create interactive charts, maps, and other graphics. It was developed with the aim of providing a simple yet powerful platform for individuals and businesses to create visually engaging content that can be easily shared and embedded on websites, social media platforms, and presentations.
One of the key features of Infogram is its intuitive interface that makes it easy for users to create professional-quality graphics without any design experience. The software offers a wide range of customizable templates, themes, and fonts that can be used to create eye-catching charts, infographics, and maps.
Infogram also offers a range of data visualization tools that allow users to quickly and easily turn complex data into clear and concise visual representations. These tools include bar charts, line graphs, pie charts, scatterplots, and heat maps, among others.
In addition to its data visualization capabilities, Infogram also allows users to add interactive elements to their graphics. This includes clickable elements, such as buttons and links, as well as animations and hover effects that can help to enhance the user experience.
Another key benefit of Infogram is its collaborative features, which allow multiple users to work on the same project simultaneously. This makes it easy for teams to collaborate on projects and share ideas, feedback, and revisions in real-time.
Overall, Infogram is a powerful and user-friendly tool that can help individuals and businesses create engaging and informative graphics. Whether you're looking to create charts, maps, or infographics, this software offers everything you need to get started.

edited by
Emily Collins is a freelance writer with over a decade of experience in the field. Emily has a passion for all things tech, especially AI-powered tools and GPT-3 & GPT-4 apps. She is a self-proclaimed geek and developer, always looking for the latest and greatest in software and coding. When she's not writing, Emily can usually be found tinkering with her computer, playing video games, or reading science fiction novels. With her unique combination of writing skills and tech expertise, Emily is a valuable asset to any project she takes on.


