 New
New
 Free
Free
 Home
Home

Olli.ai is a company that is revolutionizing how businesses work with data. With their innovative tools, teams can quickly and easily access the power of data to make more informed decisions and save time. Olli's vision is to make data accessible to everyone, and they are backed by major investors who believe in this mission. By using Olli's products, businesses can unlock their data's potential and gain the insights they need to succeed.
Pricing: Contact for Pricing - Paid plans start from $ 60/mo
Tags: business owner powerful algorithms researcher data visualizations analyze sales data
For more information, jump to:
Screenshots | Videos | Similar Tools | FAQs | Pros and Cons | Facts | Contact Info


Product Screenshots
Video Reviews
Similar Tools to Olli.ai
-
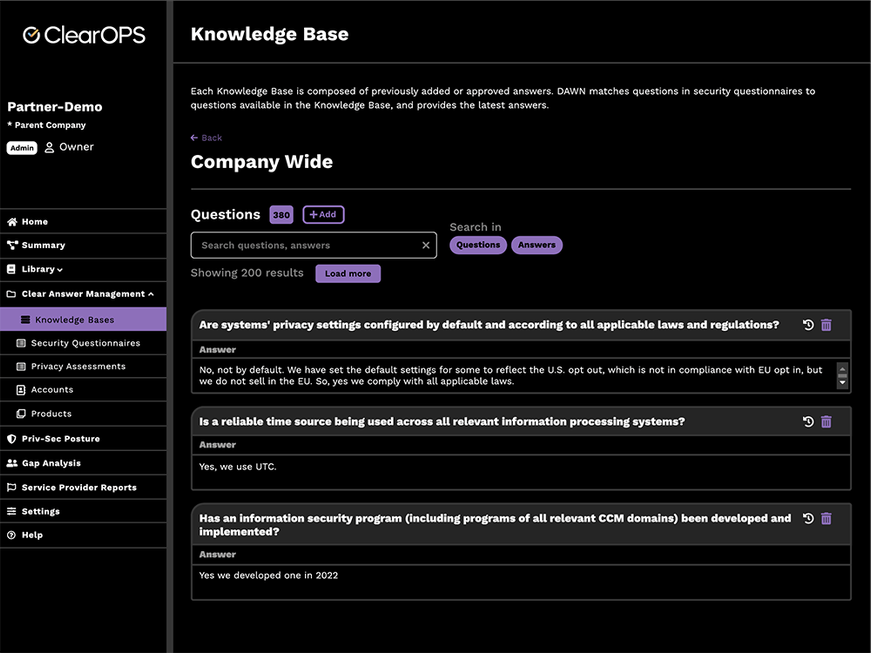
You sourced the customer, run demos, had the pricing discussion only to be stuck in "legal" or "infosec." Clear Answer Management unlocks the last step of the sale, i.e. your customer's information security review process, by using a relational database to pre-populate new questionnaires. Update 7.2023: Generative AI integration powers new response population for questionnaires and advanced search with natural language!
 Contact for Rates
#Database
Contact for Rates
#Database
-
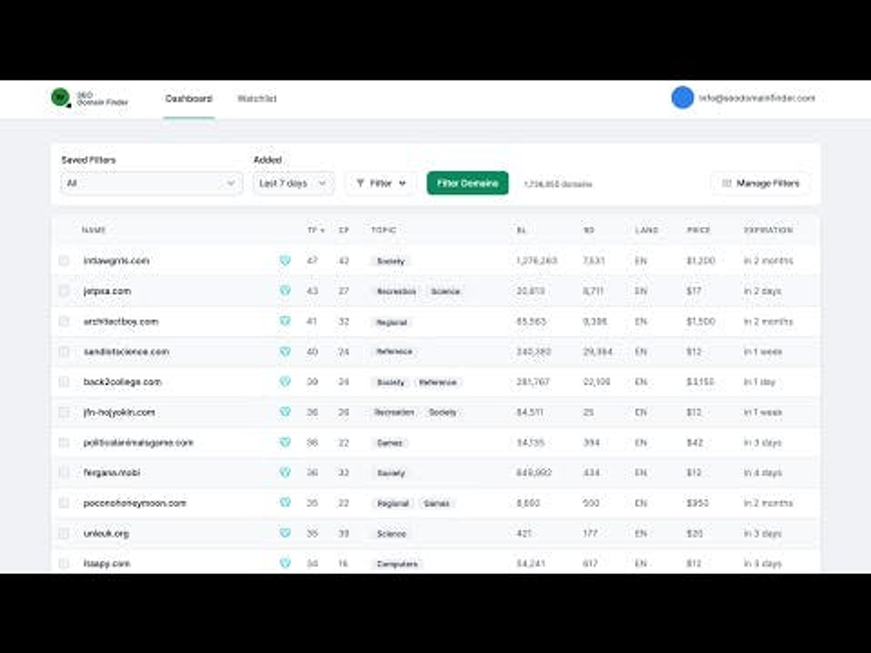
A comprehensive database of domains and easy-to-use filters wrapped up in a modern user interface that makes finding domains for your new niche website or PBN blog a breeze.
Contact for Rates
#Database
-
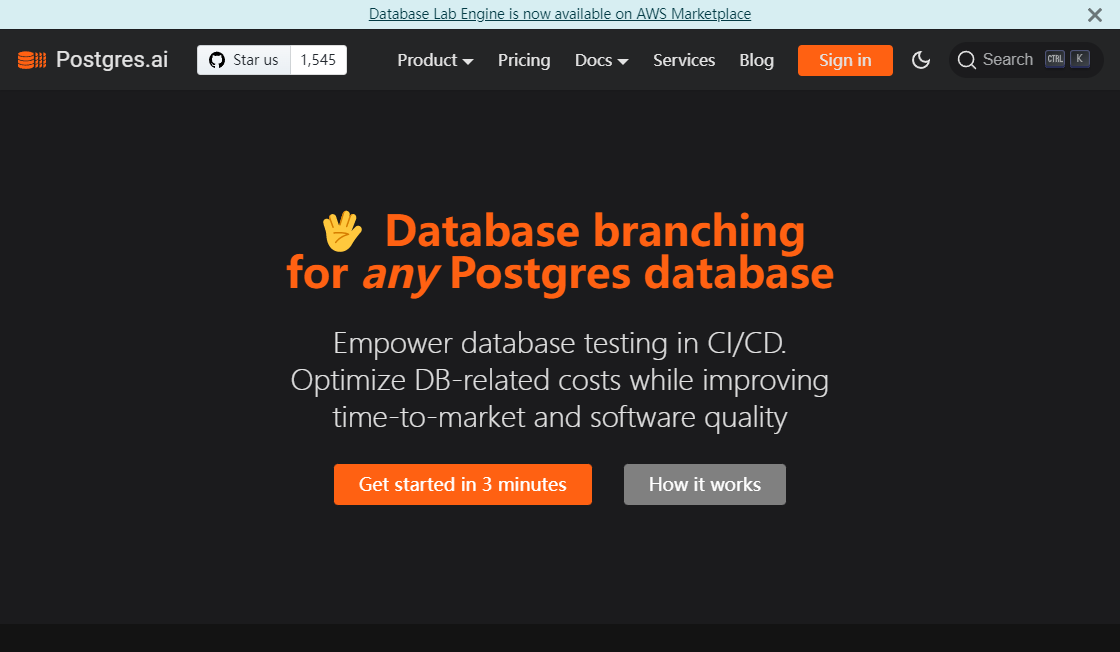
Postgres AI is a cutting-edge platform that harnesses the power of machine learning and artificial intelligence to optimize Postgres databases. It provides advanced features that enable users to manage, monitor, and tune their databases to achieve optimal performance. With its intuitive interface and customizable dashboards, Postgres AI makes it easy for users to drill down into critical metrics and identify potential issues before they become problems. Whether you're a developer, DBA, or data scientist, Postgres AI is a must-have tool for anyone looking to streamline their database management processes and achieve maximum efficiency.
Free Trial
#Database
-
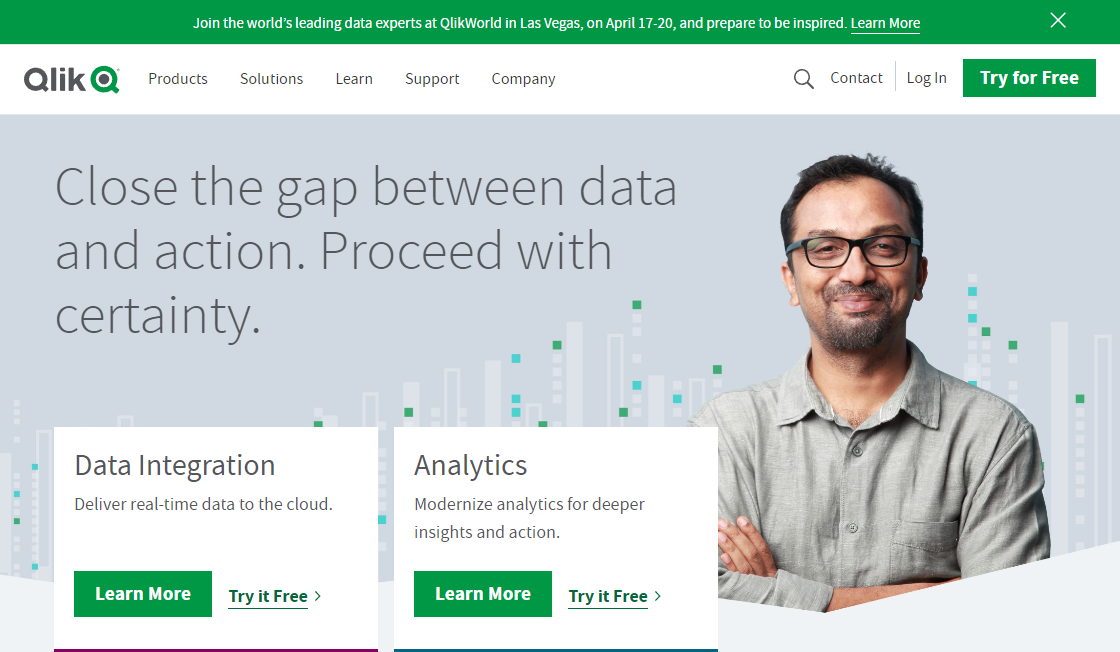
Qlik is a comprehensive data management platform that has been created to enhance the speed, precision, and efficiency of data-driven decision-making. With its end-to-end capabilities, Qlik empowers organizations to leverage their data assets and unlock insights that can help drive business growth. By providing users with powerful tools for data visualization, analysis, and reporting, Qlik has become a go-to solution for businesses looking to streamline their data management processes and make more informed decisions based on real-time information. In this article, we will delve deeper into the features and benefits of Qlik and explore how it can transform your organization's data management practices.
Freemium
#Database
-
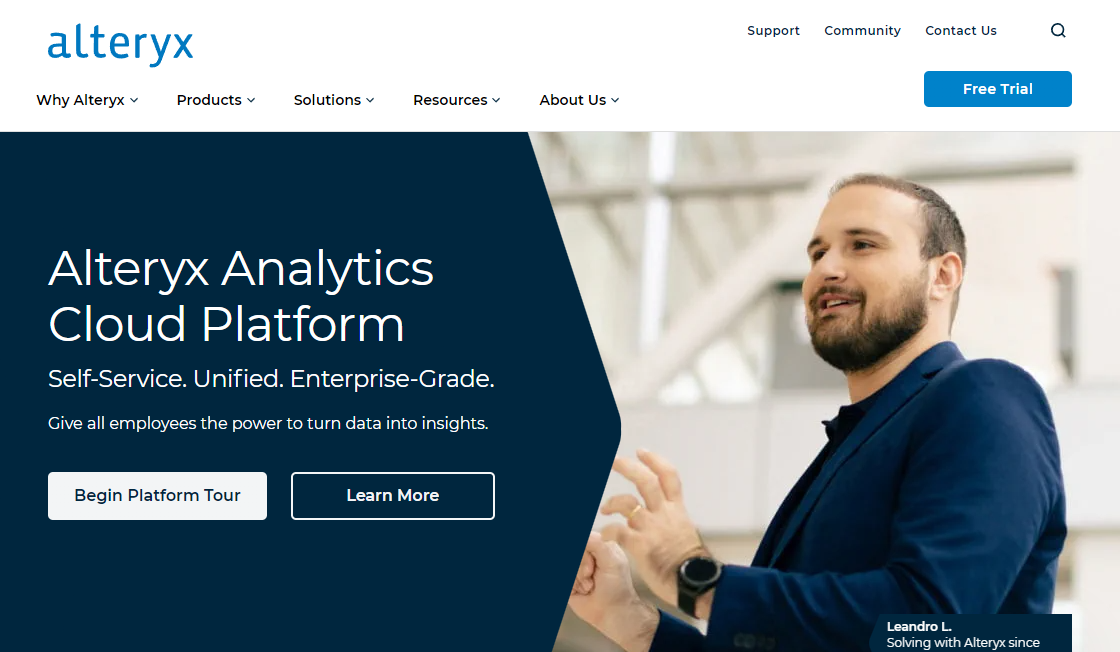
Alteryx is a game-changing analytics platform that enables businesses to explore and predict outcomes with the help of an automated process. This end-to-end platform has revolutionized the way companies approach data analytics, making it easier and more accessible for everyone. With Alteryx, businesses can streamline their analytics process and make informed decisions based on accurate insights. The platform's user-friendly interface and automation capabilities allow users to focus on analyzing data rather than spending time on manual tasks. In this article, we will delve into the key features and benefits of Alteryx and how it can help businesses gain a competitive advantage.
Contact for Rates
#Database
-
Indico.io is a comprehensive natural language processing platform that caters to businesses of all sizes. It provides a range of APIs that enable users to perform various tasks, including sentiment analysis, emotion detection, and text categorization. With its advanced features, Indico.io offers an efficient and cost-effective solution for businesses looking to improve their data analysis capabilities. Its user-friendly interface and robust algorithms make it a popular choice among businesses seeking to streamline their operations and gain insights into customer behavior.
Contact for Rates
#Database
Top Rated Tools
-
Canva Text-to-Image
AI-Generated Graphics
Freemium #Image Editing -
Duolingo
Duolingo: Learn Spanish, French and other languages for free
Contact for Rates #Learning Assistant -
Alien Genesys
AI Powered DNA Analysis
Contact for Rates #Generative AI -
Media.io
Media.io - Online Free Video Editor, Converter, Compressor
Contact for Rates #Image Editing -
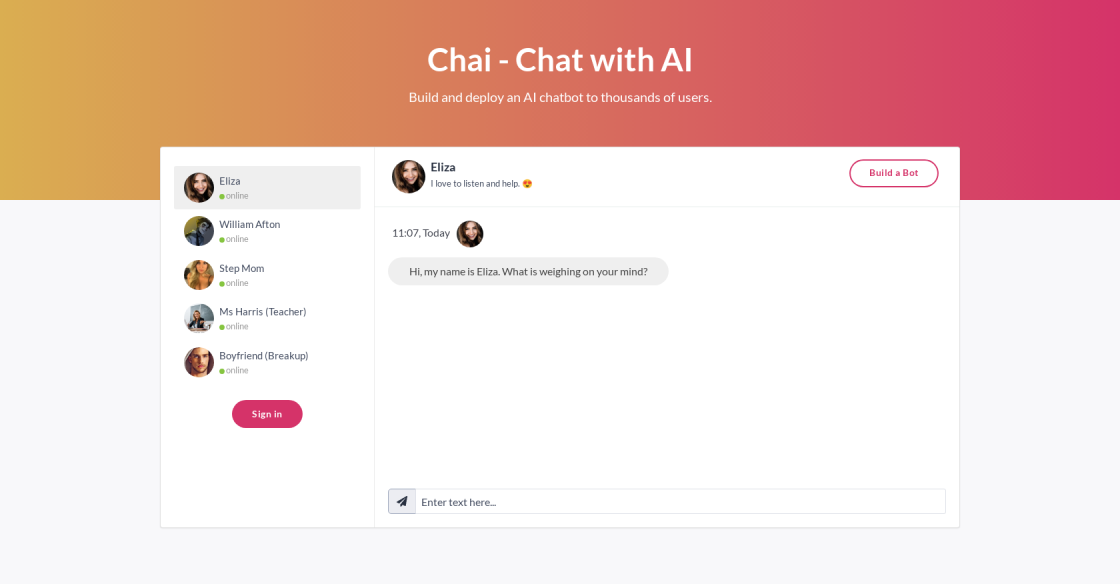
Chai
AI Writing Assistant
Free #Conversation -
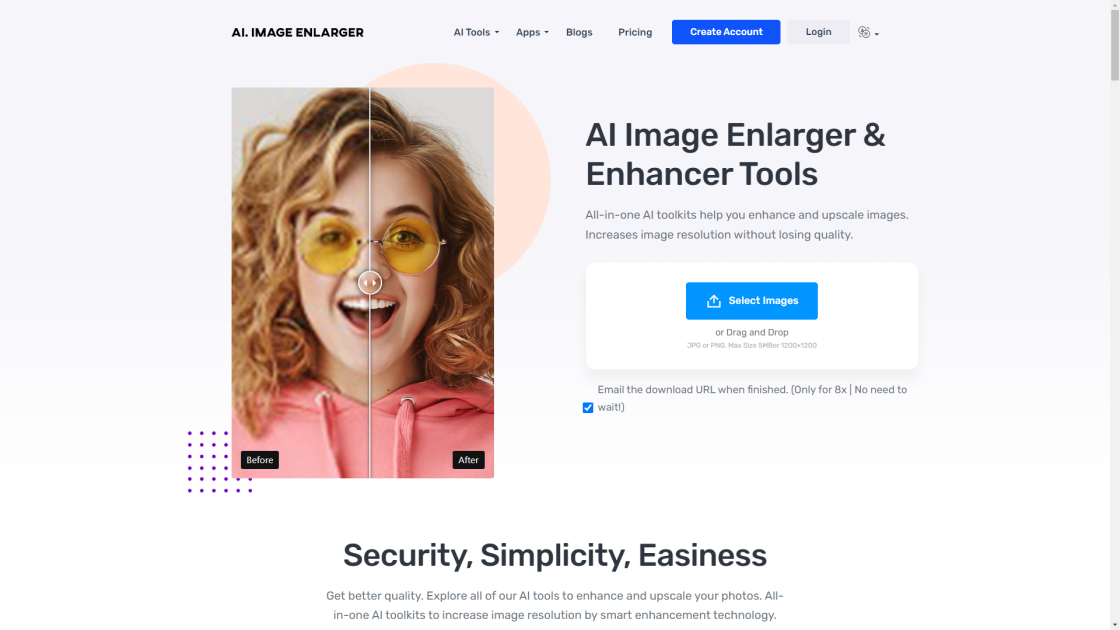
AI Image Enlarger
AI Image Enlarger | Enlarge Image Without Losing Quality!
Paid #Image Editing -
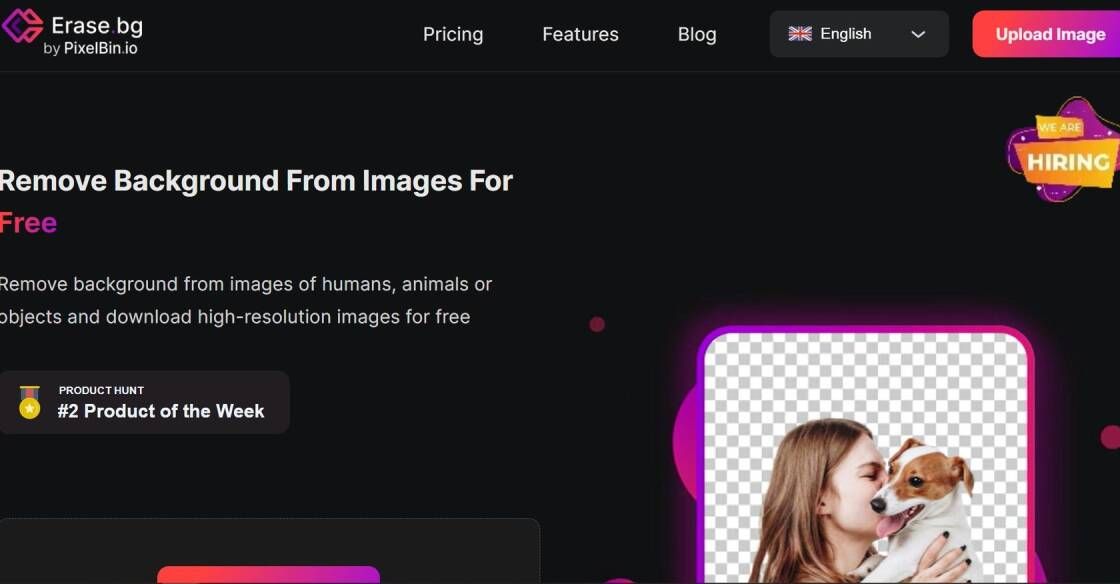
Erase.bg
Free Background Image Remover: Remove BG from HD Images Online - Erase.bg
Free #Image Editing -
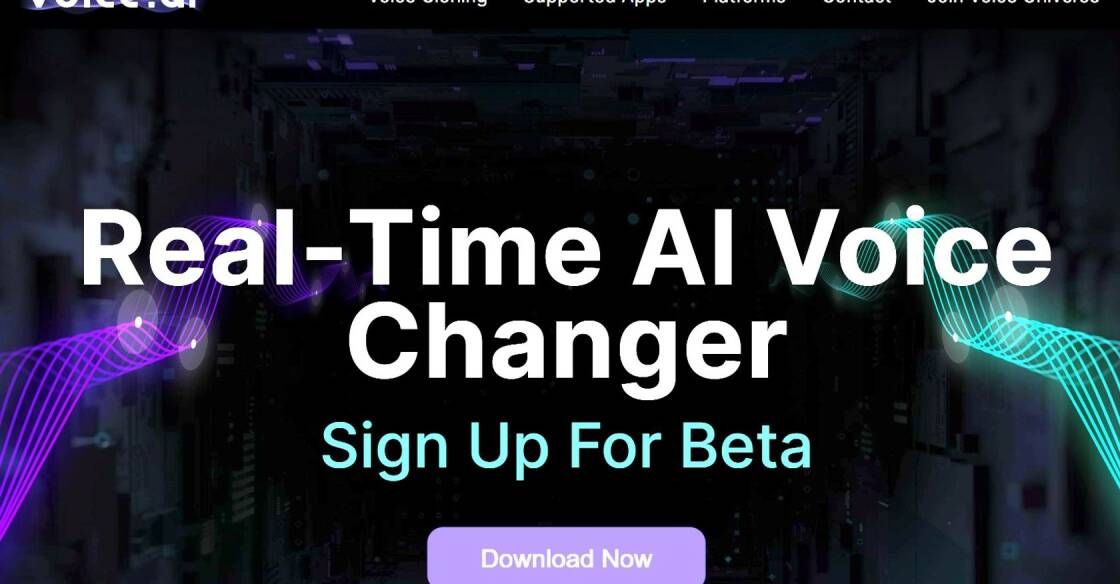
Voice-AI
Voice Analysis and Optimization
Freemium #Audio Editing

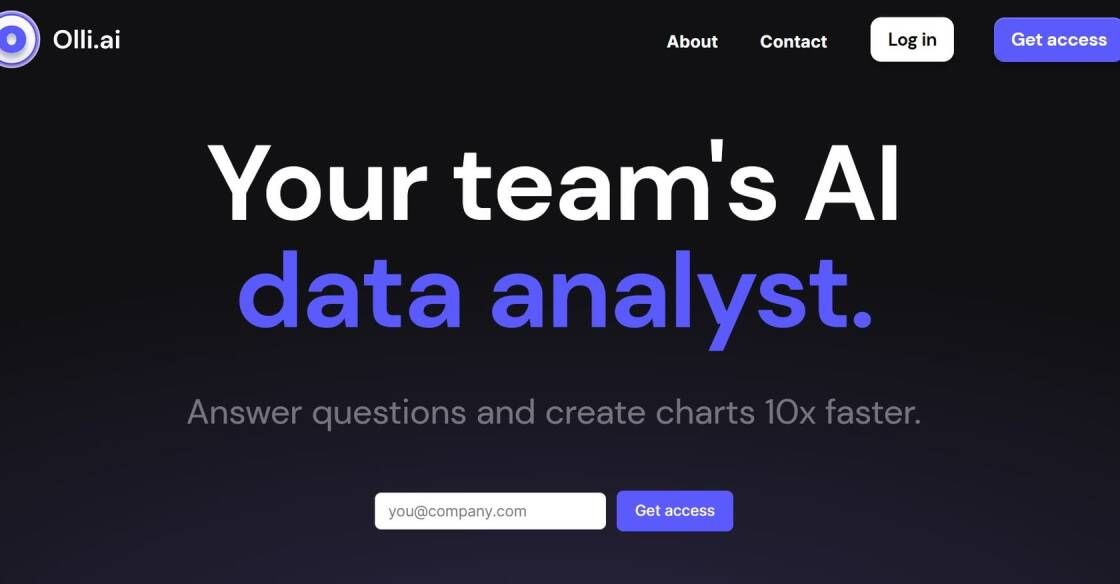
In today's data-driven world, visualizing complex information has become a crucial part of decision-making processes. However, creating data visualizations that are both accurate and visually appealing can be a daunting task. That is where Olli.ai comes in. Olli.ai is a powerful data visualization tool that enables users to quickly create stunning visuals from web or file data. With its easy-to-use interface and intuitive drag-and-drop features, even non-technical users can create engaging charts, graphs, and maps in minutes. Olli.ai's automated data cleaning and formatting features also help ensure data accuracy, saving users hours of manual data preparation. Whether you're a business analyst, marketer, or data scientist, Olli.ai allows you to focus on analyzing your data rather than struggling to visualize it. With its ability to create beautiful and informative visuals quickly, Olli.ai is a game-changer in the world of data visualization.

Top FAQ on Olli.ai
1. What is Olli.ai?
Olli.ai is a data visualization tool that allows users to create visually appealing charts and graphs from web or file data in just a few clicks.
2. How does Olli.ai work?
Olli.ai uses machine learning algorithms to analyze and interpret data sets, and then generates interactive visualizations based on the insights it has gathered.
3. Can I import my own data into Olli.ai?
Yes, you can upload your own data files to Olli.ai, or connect to external data sources such as Google Sheets, SQL databases, or APIs.
4. What types of visualizations can I create with Olli.ai?
Olli.ai supports a wide variety of chart types, including line graphs, bar charts, pie charts, scatter plots, and more.
5. Is Olli.ai easy to use?
Yes, Olli.ai is designed to be intuitive and user-friendly, with a simple drag-and-drop interface that requires no coding or technical skills.
6. Can I customize the appearance of my visualizations in Olli.ai?
Yes, Olli.ai provides a range of customization options, including color schemes, fonts, labels, and annotations.
7. Does Olli.ai offer any collaboration features?
Yes, Olli.ai allows you to share your visualizations with others and collaborate in real-time, with the ability to grant different levels of access and permissions.
8. Is my data secure with Olli.ai?
Yes, Olli.ai takes data security and privacy very seriously, with strict measures in place to protect your data and ensure compliance with industry regulations.
9. What platforms does Olli.ai support?
Olli.ai is a web-based application that can be accessed from any device with an internet connection, including desktops, laptops, tablets, and smartphones.
10. What pricing plans are available for Olli.ai?
Olli.ai offers a range of pricing plans, including a free basic plan and premium plans with additional features and capabilities.
11. Are there any alternatives to Olli.ai?
| Competitor | Key Features | Pricing | Ease of Use | Integrations |
|---|---|---|---|---|
| Tableau | Interactive dashboards, drag-and-drop interface, real-time data integration | Starts at $12 per user per month | Moderate learning curve | Integrates with over 65 data sources including Salesforce, Google Analytics, and Amazon Redshift |
| Power BI | Customizable dashboards, natural language query, AI-powered insights | Free trial available, paid plans start at $9.99 per user per month | Easy to use with Microsoft Office familiarity | Integrates with Microsoft products, as well as Salesforce, Google Analytics, and others |
| QlikView | Associative search, in-memory processing, advanced analytics | Pricing available upon request | Steep learning curve | Integrates with over 40 data sources including Salesforce, Oracle, and SAP |

Pros and Cons of Olli.ai
Pros
- Easy to use: Olli.ai is user-friendly and requires no coding or technical skills.
- Time-saving: It allows users to create data visualizations quickly, saving time and effort.
- Flexible: Olli.ai can create visualizations from various sources, including web and file data.
- Customizable: Users can customize their visualizations by choosing different chart types, colors, and other design elements.
- Interactive: The generated visualizations are interactive, allowing users to explore and analyze the data further.
- Cost-effective: Olli.ai offers affordable pricing plans for individuals and businesses.
- Collaborative: Users can share their visualizations with others and collaborate on projects in real-time.
- Accessible: Olli.ai works on various devices and platforms, making it accessible for everyone.
Cons
- Limited customization options for visualizations
- May not be able to handle large or complex datasets
- Requires some technical knowledge to use effectively
- Only available as a web-based tool, requires internet connection
- Limited support for different data formats and sources
- No option for collaboration or sharing with other users
- May not be suitable for advanced data analysis or modeling
- No option for integrating with other software or tools.

Things You Didn't Know About Olli.ai
Olli.ai is a revolutionary tool that helps users create data visualizations from web or file data quickly. It is an excellent platform for business analysts, data scientists, and researchers who want to turn their data into actionable insights.
Here are some things you should know about Olli.ai:
1. Easy-to-Use Interface
Olli.ai has a user-friendly interface that makes it easy for users to create data visualizations without any prior experience. The platform provides a drag-and-drop feature that enables users to upload data easily and visualize it in just a few clicks.
2. Multiple Data Sources
Olli.ai supports multiple data sources, including CSV, Excel, JSON, SQL, and Google Sheets. Users can also connect to web data sources, such as Salesforce, HubSpot, and other CRM and marketing automation tools.
3. Interactive Visualizations
The platform offers a wide range of interactive visualizations, including bar charts, line charts, scatter plots, heat maps, and more. Users can customize the visualizations by changing colors, fonts, and labels to match their branding and style.
4. Collaboration and Sharing
Olli.ai enables users to collaborate with team members and share their visualizations via email, Slack, or embed them on websites. Users can also download the visualizations in various formats, including PNG, JPEG, SVG, PDF, and HTML.
5. AI-Powered Insights
Olli.ai leverages artificial intelligence (AI) to provide insights and recommendations on data visualization best practices. The platform uses machine learning algorithms to suggest the best chart types and layouts based on the data.
In conclusion, Olli.ai is an exceptional tool that simplifies the process of creating data visualizations. Its intuitive interface, support for multiple data sources, interactive visualizations, collaboration, sharing, and AI-powered insights make it a must-have for anyone looking to turn their data into insights.
Get in touch with Olli.ai

edited by
Samantha Lee is a freelance writer with over a decade of experience writing for a variety of industries. She is an avid enthusiast of AI powered tools and GPT-3 & GPT-4 apps, constantly exploring new ways to incorporate these technologies into her work. As a self-proclaimed geek, Samantha spends her free time diving deep into the latest tech gadgets and coding projects. Her writing has been featured in numerous publications and she has won several writing awards. When she's not writing or coding, you can find Samantha hiking or exploring new restaurants in her hometown of San Francisco.


