 New
New
 Free
Free
 Home
Home


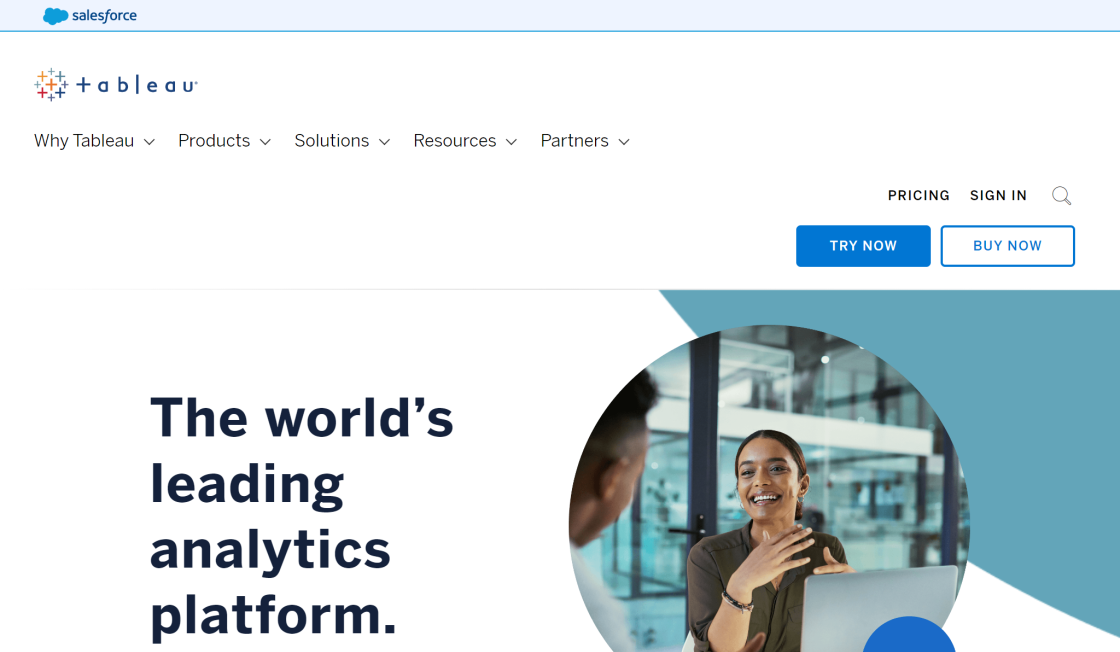
Tableau is a powerful business intelligence software that empowers users to explore, visualize, and present data in rows and columns. It provides a user-friendly interface that makes it easy for non-technical users to analyze complex data sets quickly. Tableau allows organizations to make better-informed decisions by providing meaningful insights from raw data. With its advanced data visualization capabilities, Tableau enables users to create stunning, interactive dashboards that help them uncover hidden patterns, trends, and outliers. In this article, we will explore the features and benefits of Tableau and how it can help businesses gain a competitive edge in today's data-driven world.
Usage: Other
Pricing: Free Trial - Free trial available, pricing starts at $70/month.
Tags: insights software competitive edge organizations data visualization
For more information, jump to:
Screenshots | Videos | Similar Tools | FAQs | Pros and Cons | Facts | Contact Info


Product Screenshots
Video Reviews
Similar Tools to Tableau
-
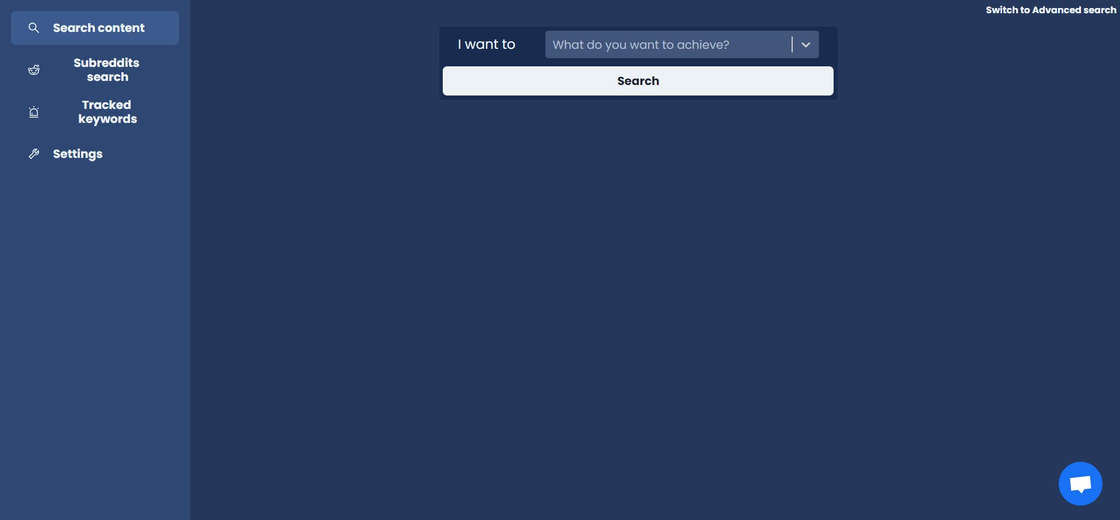
Olwi monitors Reddit product mentions for you so you don't have to manually search reddit for your business.
 Contact for Rates
#Others
Contact for Rates
#Others
-
Your Ultimate AI-Powered Background Remover and Editor for WooCommerce Product Images.
Contact for Rates
#Others
-
Luminar Neo empowers photographers of all skill levels to unleash their creativity and transform their visions into reality with advanced AI-based technologies while providing the artist with complete control over the final image. Luminar Neo has won the Red Dot Award and TIPA's Best Imaging Software 2022 and 2023.
Contact for Rates
#Others
-
Activate OTP-less. One tap sign in with WhatsApp, Google and Apple. Fast, simple, secure.
Free
#Others
-
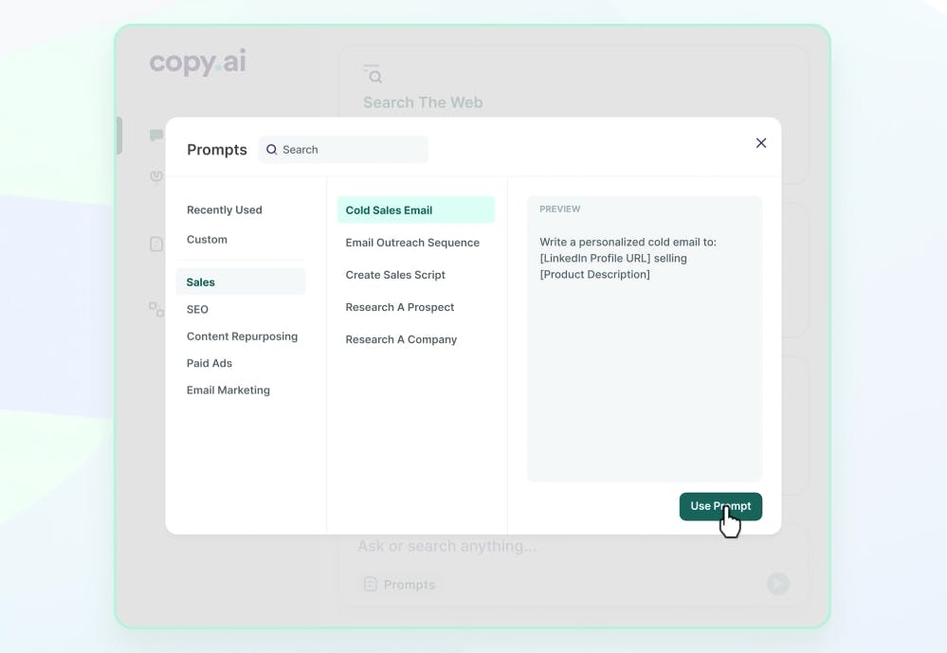
Over 1 million people use our ai copywriting tools to help them write social media posts, website content, and blog posts in seconds.
Free
#Others
-
Fuel is a free, easy to use native macOS app to track gas prices of your favorite blockchains like ETH, AVAX, FTM and many more Using your private iCloud storage, all your data is synced safely between devices.
Free
#Others


Top Rated Tools
-
Voicemod
Free Real Time Voice Changer & Modulator - Voicemod
Free #Audio Editing -
VidIQ
Boost Your Views And Subscribers On YouTube - vidIQ
Freemium #Others -
Perplexity AI
Building Smarter AI
Free #Chatgpt Alternative -
TwitterBio
AI Twitter Bio Generator – Vercel
-
Date Night Short Film
AI Generated Script: How We Made a Movie With AI | Built In
Contact for Rates #Writing Assistant -
Make (fomerly Known As Integromat)
Automation Platform
Contact for Rates #Automation -
Jenni
Supercharge Your Writing with Jenni AI
Paid #SEO Assistant -
Palette.fm
AI Generated Music for Your Projects
Freemium #Image Editing


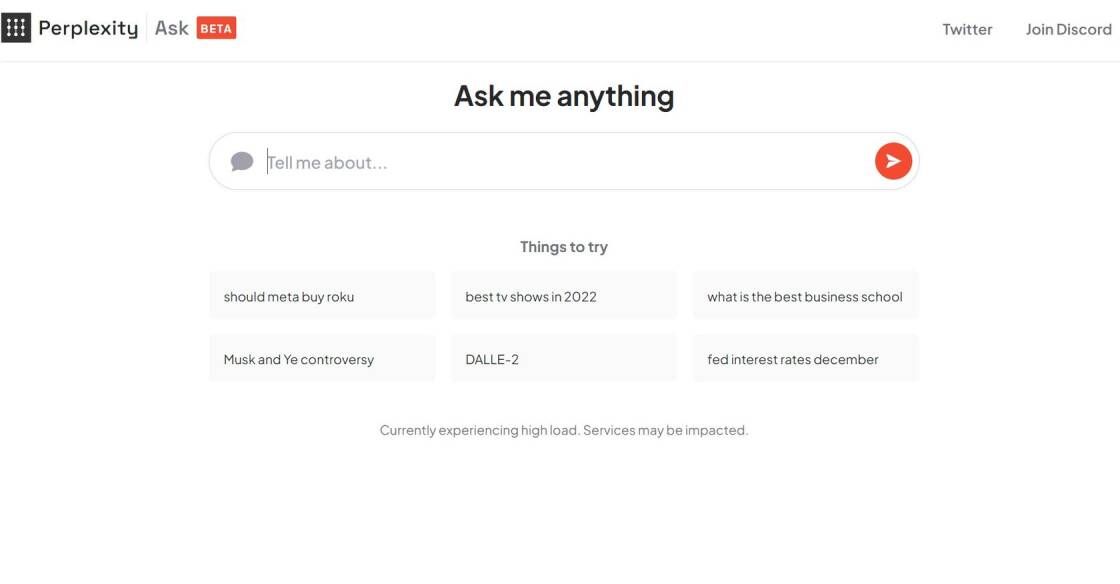
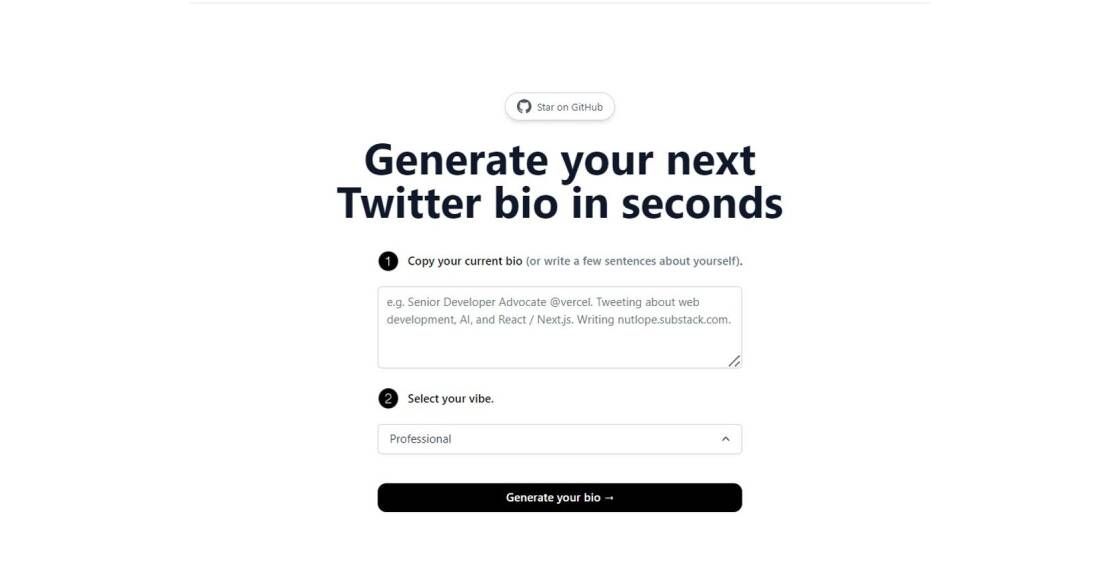

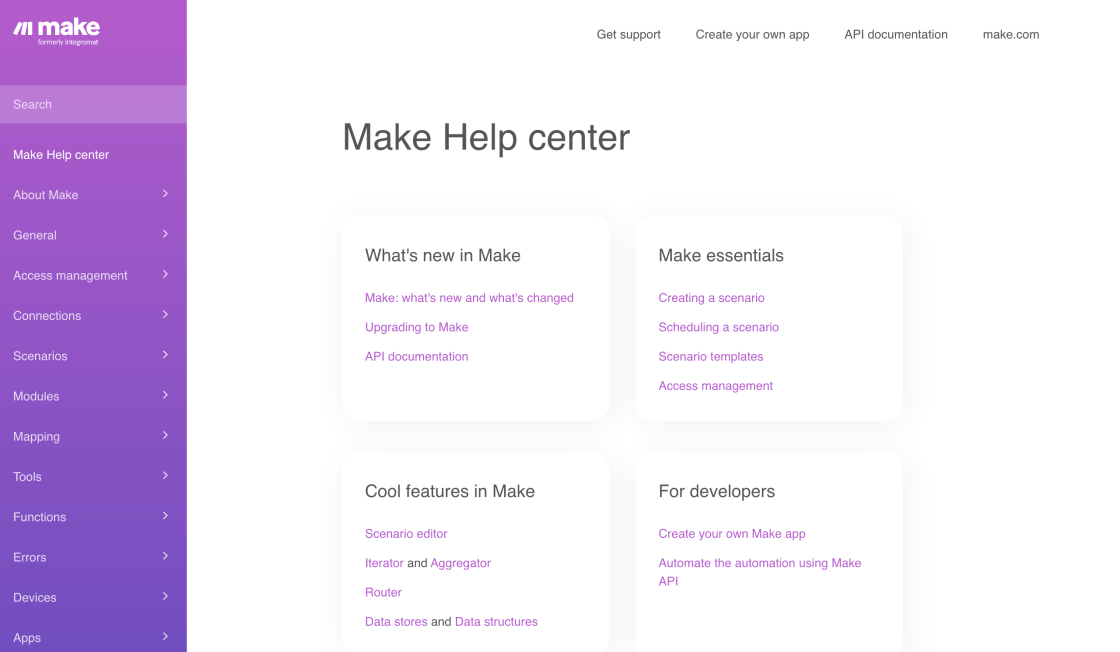

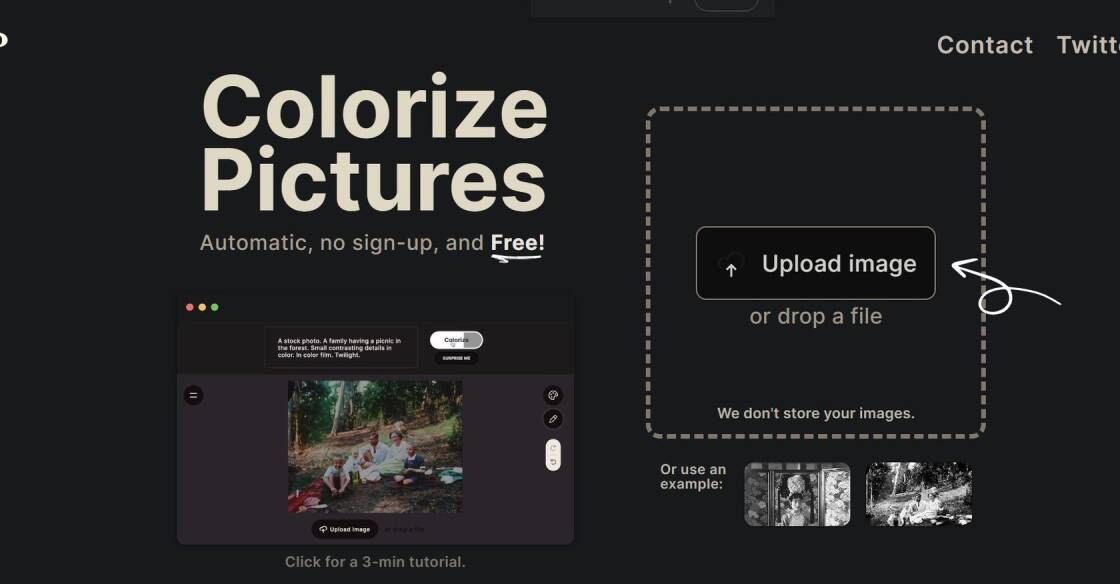
Tableau is a powerful business intelligence software that has revolutionized the way organizations analyze and present data. Developed by Tableau, this software enables users to explore and visualize complex data sets in rows and columns, helping them gain valuable insights into their business operations. With its intuitive drag-and-drop interface and interactive dashboards, Tableau empowers users to create stunning visualizations without any coding or technical expertise. Its robust features, such as real-time data connectivity, advanced analytics, and collaboration tools, make it a popular choice among businesses of all sizes and industries. Whether it's analyzing sales figures, monitoring customer behavior, or tracking operational metrics, Tableau provides the flexibility and agility to turn data into actionable insights. In this article, we will delve deeper into Tableau's capabilities and explore how it can help businesses make better decisions based on data-driven insights.

Top FAQ on Tableau
1. What is Tableau?
Tableau is a business intelligence software that helps users explore, visualize and present data in rows and columns.
2. How does Tableau work?
Tableau connects to various data sources, such as spreadsheets, databases or cloud services, allowing users to create interactive dashboards, reports and visualizations.
3. What kind of data can Tableau handle?
Tableau can handle a wide range of data types and formats, including text, numbers, dates, geographic coordinates, and more.
4. Can Tableau be used for data analysis?
Yes, Tableau is a powerful tool for data analysis, as it allows users to filter, sort, group, and aggregate data in real-time.
5. Is Tableau easy to use for beginners?
Tableau has a user-friendly interface and offers a variety of resources, such as tutorials, online courses, and a community forum, making it easy for beginners to get started.
6. What are the benefits of using Tableau?
Tableau enables users to gain insights from their data, make informed decisions, and communicate their findings effectively with others.
7. Does Tableau support collaboration?
Yes, Tableau offers features for sharing and collaborating on data, such as publishing dashboards to Tableau Server or Tableau Online, or embedding them in other applications.
8. Can I customize my Tableau dashboard?
Yes, Tableau allows users to customize their dashboard by choosing different charts, graphs, colors, and layouts, according to their needs and preferences.
9. Is Tableau compatible with other software tools?
Yes, Tableau integrates with a wide range of third-party tools and services, such as Microsoft Excel, Salesforce, Google Analytics, and more.
10. What is the cost of using Tableau?
Tableau offers several pricing plans, including a free trial, personal, professional, and enterprise editions, depending on the user's needs and budget.
11. Are there any alternatives to Tableau?
| Competitor | Description | Key Features | Price |
|---|---|---|---|
| Power BI | A business analytics service by Microsoft that provides interactive visualizations and business intelligence capabilities with an interface simple enough for end users to create their own reports and dashboards. | Customizable dashboards, natural language queries, AI insights | $9.99/user/month |
| QlikView | A business discovery platform that provides guided analytics applications and dashboards designed for business challenges. | Associative data indexing, real-time data processing, collaborative analytics | Pricing available upon request |
| SAP Lumira | A self-service data visualization tool by SAP that allows users to create interactive charts, graphs, infographics, and maps. | Drag-and-drop interface, predictive analytics, advanced data blending | $185/user/year |
| IBM Cognos Analytics | A web-based reporting and analytics tool by IBM that helps users explore and report on data from various sources. | Customizable dashboards, predictive analytics, collaboration tools | Pricing available upon request |
| Domo | A cloud-based business management platform that provides real-time data visualization and collaboration tools. | Customizable dashboards, alerts, mobile app | Pricing available upon request |

Pros and Cons of Tableau
Pros
- Interactive dashboards and visualizations that make it easy to analyze and understand data
- User-friendly interface with drag-and-drop functionality for creating charts, graphs, and other visualizations
- Ability to connect to a wide range of data sources, including databases, spreadsheets, and cloud-based services
- Powerful data blending capabilities that allow users to combine disparate data sources into a single view
- Advanced analytics features such as predictive modeling and statistical analysis
- Collaborative functionality that enables teams to share insights and work together on projects
- Integration with other business intelligence tools and platforms, such as R and Hadoop
- Scalable architecture that can handle large volumes of data and support enterprise-level deployments
- Regular updates and new features that ensure the software stays up-to-date with the latest trends and technologies.
Cons
- Expensive licensing fees for both individual and enterprise use
- Steep learning curve due to complex interface and advanced features
- Limited customization options for visualizations and dashboards
- Requires significant processing power and memory, making it difficult to use on older machines or with large datasets
- Limited ability to handle real-time data streaming or complex data transformations
- Limited collaboration features for teams working on the same project
- Data security concerns due to lack of user access controls and encryption options
- Limited support for non-English languages and character sets.

Things You Didn't Know About Tableau
Tableau is a powerful business intelligence software that allows users to explore, visualize, and present data in a simple and intuitive way. With its user-friendly interface and advanced features, Tableau is quickly becoming one of the most popular tools for data analysis in businesses of all sizes.
One of the key benefits of Tableau is its ability to connect to a wide variety of data sources, including spreadsheets, databases, and cloud-based platforms. This makes it easy for users to import and analyze data from multiple sources, enabling them to gain valuable insights into their business operations.
Another major advantage of Tableau is its powerful visualization tools. With just a few clicks, users can create stunning visualizations that help them better understand their data and communicate their findings to others. Tableau's drag-and-drop interface also makes it easy to create interactive dashboards, allowing users to explore their data in real-time and drill down into specific areas of interest.
Tableau also includes advanced analytics capabilities, such as statistical modeling and forecasting, that allow users to identify trends and patterns in their data. With these tools, businesses can make more informed decisions and optimize their operations for maximum efficiency.
Finally, Tableau offers a wide range of training and support resources to help users get the most out of the software. Whether you're a beginner or an experienced data analyst, there are plenty of resources available to help you master Tableau and take your data analysis skills to the next level.
Overall, Tableau is an essential tool for businesses looking to gain deeper insights into their data and make more informed decisions. With its powerful features and intuitive interface, it's no wonder that Tableau has become the go-to choice for data analysis in organizations around the world.
Get in touch with Tableau

edited by
Jack Richards is a self-proclaimed geek and AI enthusiast who has been freelancing as a writer for over a decade. With a rich writing experience in various niches, Jack's love for technology led him to explore the world of AI-powered tools and GPT-3 & GPT-4 apps. He has been fascinated with the possibilities that AI can bring to the writing world, and spends much of his time experimenting with different tools and software. Jack's passion for writing and technology has led him to create some of the most unique and thought-provoking content in his field, making him a recognized name among the writing community.


